Climograph
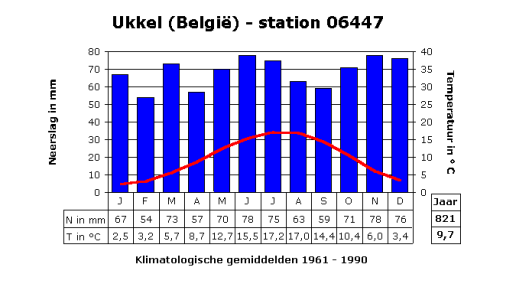
The climate at a certain place in the world determines which vegetation can grow. A climate type can be identified using a determination table based on a climograph. The climograph is a graphical representation of the annual cycle of the average climate at a specific location. It is created using monthly data on precipitation amounts and average temperatures observed over a long period at that location. The elements that make up the climograph are:
- The name of the observation station and the station code.
- The months of the year.
- The precipitation amounts (N in mm) for each month and the total for the entire year.
- The average temperatures (T in °C) for each month and the average temperature for the entire year.

Ukkel (Belgie) - station 06447
J    F   M   A     M     J    J    A     S     O    N   D     Y
67  54  73  57    70    78   75   63    59    71   78   76  821
2.5 3.2 5.7 8.7  12.7  15.5 17.2 17.0  14.4  10.4  6.0  3.4  9.7
For an example file, click here: klimatogram.txt
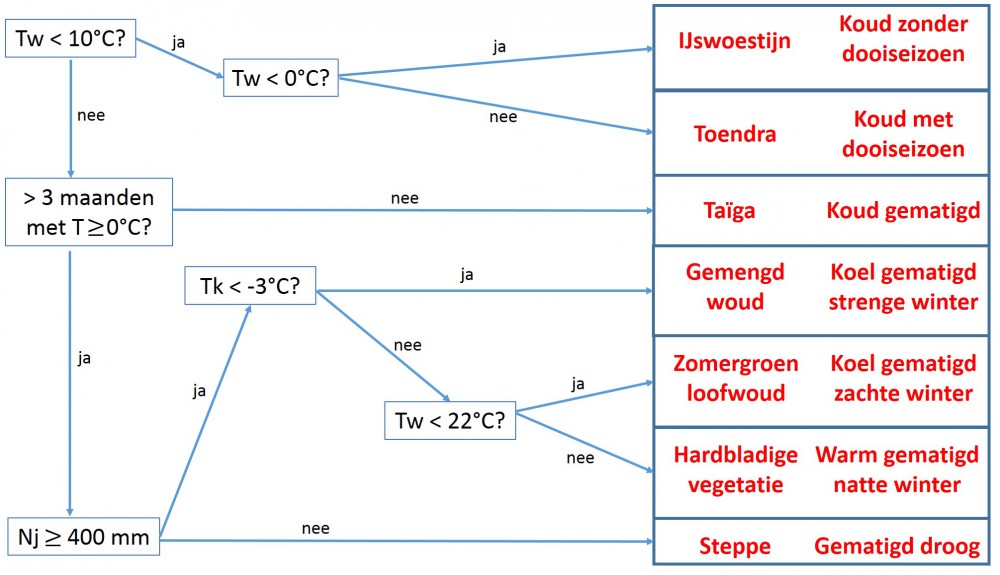
Determination table:

Where Tw stands for the warmest monthly temperature, Tk for the coldest monthly temperature, and Nj for the total average precipitation for an entire year. For Ukkel, this means that this location has a cool climate with moderately mild winters, resulting in vegetation consisting of summer-green deciduous forests.
For a table with climate and vegetation, click here klimaat_vegetatie.txt. Copy them, so you don’t have to retype them.
Task
Write a function read_climograph that reads a file with klimatogram data. The function returns a tuple of three objects: a string with the place name, a list with the precipitation data as floating point numbers, and a list with the temperature data as floating point numbers.
Write a function tk_tw that takes a list of numbers (floats) as input and returns a tuple of two floats, representing the lowest and highest numbers, which correspond to the coldest and warmest average monthly temperatures, respectively.
Write a function climate_vegetation that takes the klimatogram data as input, namely the two lists of precipitation and temperature, and outputs a tuple of two strings with the corresponding vegetation type and climate, which you obtain according to the determination table in the figure above. For example: (“Summer-green deciduous forest”, “Cool, moderately mild winter”).
Example
>>> location, precipitation, temperature = read_climograph("climograph.txt")
>>> location
"Ukkel"
>>> precipitation
[67.0, 54.0, 73.0, 57.0, 70.0, 78.0, 75.0, 63.0, 59.0, 71.0, 78.0, 76.0, 821.0]
>>>temperature
[2.5, 3.2, 5.7, 8.7, 12.7, 15.5, 17.2, 17.0, 14.4, 10.4, 6.0, 3.4, 9.7]
>>> tk_tw(temperature)
(2.5, 17.2)
>>> climate_vegetation(precipitation, temperature)
("Summer-green deciduous forest", "Cool temperate mild winter")