The formula for the sum of the series \(1+2+\dots+n\) is \(n(n+1)/2\). What if we weren’t sure that was the right function? How could we check? Using what we learned about functions we can create one that computes the \(S_n\):
compute_s_n <- function(n){
  x <- 1:n
  sum(x)
}
How can we compute \(S_n\) for various values of \(n\), say
\(n=1,\dots,25\)? Do we write 25 lines of code calling compute_s_n?
No, that is what for-loops are for in programming. In this case, we are
performing exactly the same task over and over, and the only thing that
is changing is the value of \(n\). For-loops let us define the range
that our variable takes (in our example \(n=1,\dots,10\)), then change
the value and evaluate expression as you loop.
Perhaps the simplest example of a for-loop is this useless piece of code:
for(i in 1:5){
  print(i)
}
#> [1] 1
#> [1] 2
#> [1] 3
#> [1] 4
#> [1] 5
Here is the for-loop we would write for our \(S_n\) example:
m <- 25
s_n <- vector(length = m) # create an empty vector
for(n in 1:m){
  s_n[n] <- compute_s_n(n)
}
In each iteration \(n=1,2,\dots\) we compute \(S_n\) and store
it in the \(n^{th}\) entry of s_n.
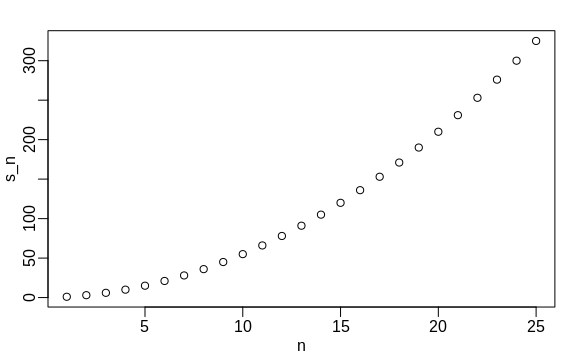
Now we can create a plot to search for a pattern:
n <- 1:m
plot(n, s_n)

If you noticed that it appears to be a quadratic, you are on the right track because the formula is \(n(n+1)/2\). which we can confirm with a table:
head(data.frame(s_n = s_n, formula = n*(n+1)/2))
#>   s_n formula
#> 1   1       1
#> 2   3       3
#> 3   6       6
#> 4  10      10
#> 5  15      15
#> 6  21      21
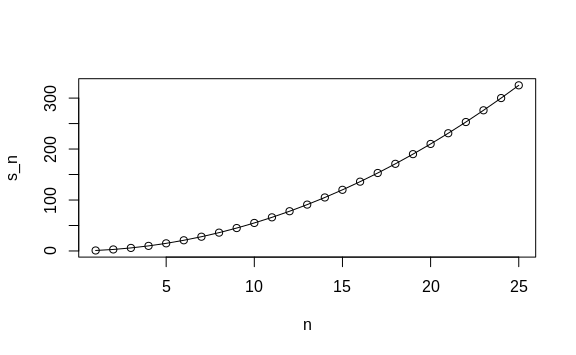
We can also overlay the two results by using the function lines to draw a line over the previously plotted points:
plot(n, s_n)
lines(n, n*(n+1)/2)
