It is claimed that in the case of data that is just barely linearly separable, a support vector classifier with a small value of “cost” that misclassifies a couple of training observations may perform better on test data than one with a huge value of “cost” that does not misclassify any training observations. You will now investigate that claim.
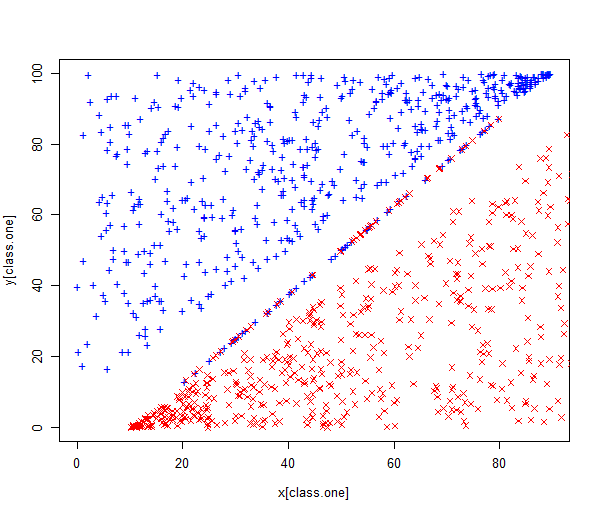
First we generate two-class data with \(p = 2\) in such a way that the classes are just barely linearly separable. We randomly generate 1000 points and scatter them across line \(x = y\) with wide margin. We also create noisy points along the line \(5x − 4y − 50 = 0\). These points make the classes barely separable and also shift the maximum margin classifier.
set.seed(1)
x.one <- runif(500, 0, 90)
y.one <- runif(500, x.one + 10, 100)
x.one.noise <- runif(50, 20, 80)
y.one.noise <- 5/4 * (x.one.noise - 10) + 0.1

x.zero <- runif(500, 10, 100)
y.zero <- runif(500, 0, x.zero - 10)
x.zero.noise <- runif(50, 20, 80)
y.zero.noise <- 5/4 * (x.zero.noise - 10) - 0.1

class.one <- seq(1, 550)
x <- c(x.one, x.one.noise, x.zero, x.zero.noise)
y <- c(y.one, y.one.noise, y.zero, y.zero.noise)

plot(x[class.one], y[class.one], col = "blue", pch = "+", ylim = c(0, 100))
points(x[-class.one], y[-class.one], col = "red", pch = 4)

z <- rep(0, 1100)
z[class.one] <- 1
data <- data.frame(x = x, y = y, z = as.factor(z))
The data set is stored in the dataframe data, has one dependent variable z and two independent variables x and y.
We will use this data set as the training data for our classifiers.
Questions
-
Compute the cross-validation error rates for support vector classifiers with a range of
costvalues using thetune()function. Use the following range:c(0.01, 0.1, 1, 5, 10, 100, 1000, 10000). Store the output of thetune()function intune.outandset.seed(2)before running the cross-validation. -
How many training errors are misclassified for each value of
costconsidered, and how does this relate to the cross-validation errors obtained? Create a dataframetrain.misclasswith two columns, the first column is named “cost” and contains all the values ofcosttested in the cross-validation (this is stored intune.out$performance$cost), the second column is named “n_misclassified” and contains the number of misclassified observations (you can find the mean error rate of each cross-validation intune.out$performance$error). - Now we generate an appropriate test data set.
x.test <- runif(1000, 0, 100)
class.one <- sample(1000, 500)
y.test <- rep(NA, 1000)
# Set y > x for class.one
for (i in class.one) {
    y.test[i] <- runif(1, x.test[i], 100)
}
# set y < x for class.zero
for (i in setdiff(1:1000, class.one)) {
    y.test[i] <- runif(1, 0, x.test[i])
}
plot(x.test[class.one], y.test[class.one], col = "blue", pch = "+")
points(x.test[-class.one], y.test[-class.one], col = "red", pch = 4)
set.seed(3)
z.test <- rep(0, 1000)
z.test[class.one] <- 1
data.test <- data.frame(x = x.test, y = y.test, z = as.factor(z.test))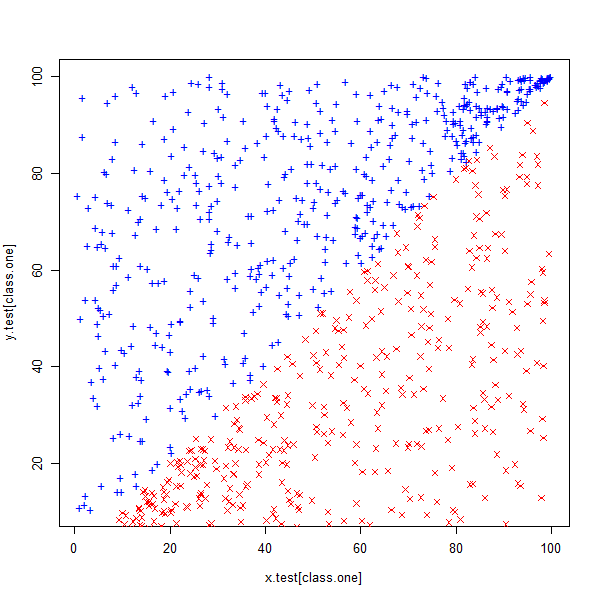
We also define the range of values we want to test for
cost.costs <- c(0.01, 0.1, 1, 5, 10, 100, 1000, 10000)Compute the test errors corresponding to each of the values of
costconsidered.- Create a vector
test.errwith the same length ascosts - Write a for loop where \(i\) goes from 1 to
length(costs)and each iteration:- Trains a SVM with a linear kernel on the training data with a cost value according to that iteration.
- The test error is stored in at the \(i\)th place in
test.err.
- Create a dataframe
test.misclasswith two columns, the first column is named “cost” and contains all the values ofcostused for training, the second column is named “n_misclassified” and contains the number of misclassified test observations according to eachcostvalue.
- Create a vector
- MC1: Which of these statements is false (only one answer)?
- The optimal cost value found for training observations is smaller than the optimal cost value found for the test observations.
- Comparing the results between 2 & 3, the SVM with a linear kernel is prone to overfitting.
- A large cost tries to correctly classify noisy-points and hence overfits the train data
- A small cost makes a few errors on the noisy-points and performs better on test data
Assume that:
- The
e1071library has been loaded