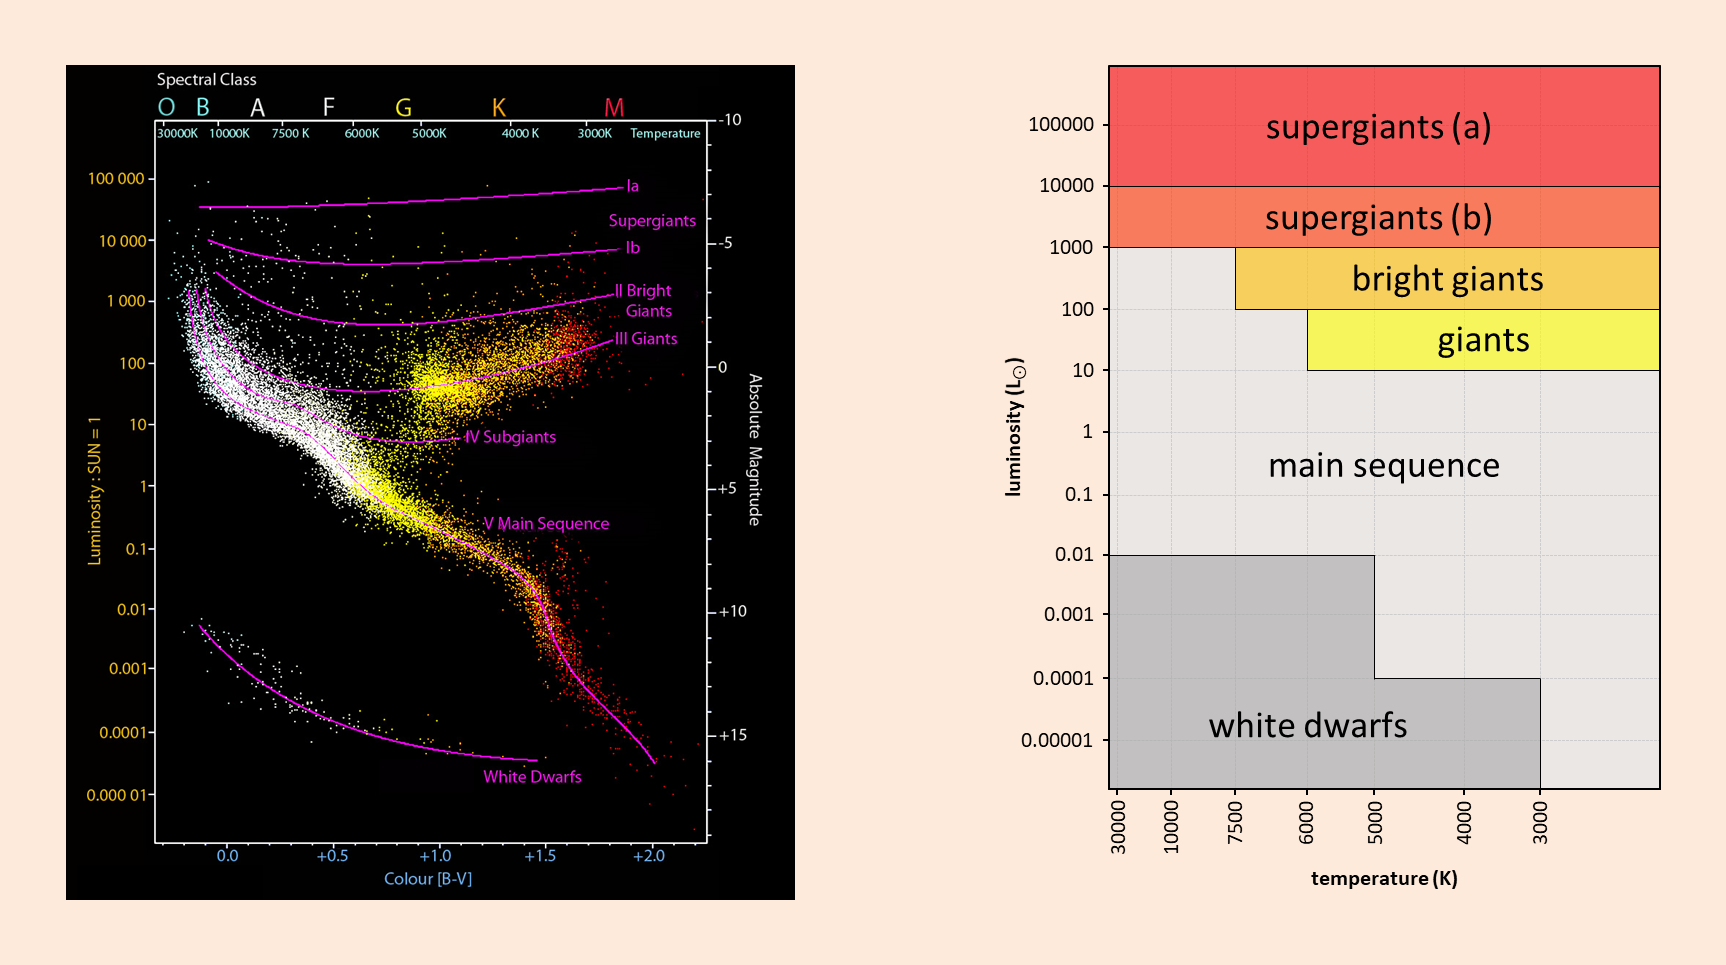
A Hertzsprung-Russell diagram or HR diagram is a scatter graph. The vertical axis shows the brightness of a star, expressed as absolute magnitude1 (magnitude2 corrected for distance and interstellar obscuration3) or relative light intensity4 towards the sun. The horizontal axis shows a variable related to surface temperature, such as the B-V color index5, the spectral type6, or the effective temperature7.
Note
The temperature increases from right to left.
The diagram is the usual base for the classification of stars and is used to describe their evolution. It was named after Ejnar Hertzsprung8 and Henry Norris Russell9 who introduced it independently around 1910.

Based on the position of the stars within a Hertzsprung-Russell diagram, the following classes are distinguished: supergiants (a), supergiants (b), bright giants, giants, the main sequence and white dwarfs. There is no univocal distinguishing of the areas within the diagram that correspond with the classes. For this assignment, we will take the picture on the right as a starting point. De borders of every area are parallel with one of the axis of the diagram and always correspond with one of the numbers on the axis.
Input
Two lines, each containing a real-valued number that respectively depicts the temperature (in Kelvin) and the light intensity (relative towards the sun) of a star. You may assume that the values of temperature and light intensity are always within the boundaries of the right picture above and that they will never form a point that is situated on a border of the areas.
Output
A description stating the class to which the star belongs, according to
the division made in the right picture above.
Example
Input:
8525.0
196000.0
Output:
supergiants (a)