Check your understanding of the previous reading: the kinds of plots and what they show, making a plot appear with show, combining plots, importing MatPlotLib, and reading a histogram.
Question 1
Match the type of graph with the kind of information that that type of graph conveys.
Question 2
Write the final function call that should be used after the following code, in order to actually make the plot appear:
import matplotlib.pyplot as plt

plt.hist([1, 7, 5, 4, 3, 5, 6, 7])
Show worked solution
plt.show(). If you do not call the show function, no graph appears. It takes no arguments, but it still needs the parentheses: without them you are not actually calling the function.
Question 3
Question 4
Question 5
Question 6
Assume that a library exists that can get lists of integers representing students' grades.
from bakery_grades import get_grades
import matplotlib.pyplot as plt

grades = get_grades()

plt.hist(grades)
plt.show()
Executing the code above generates this image:
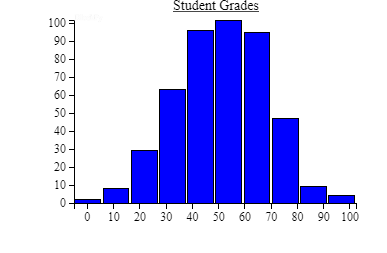
Which of the following statements is the best interpretation of the graph?
Select one answer, then check.