Drop links or images here to add them to the editor.
2.21 Create boxplot (Extra)
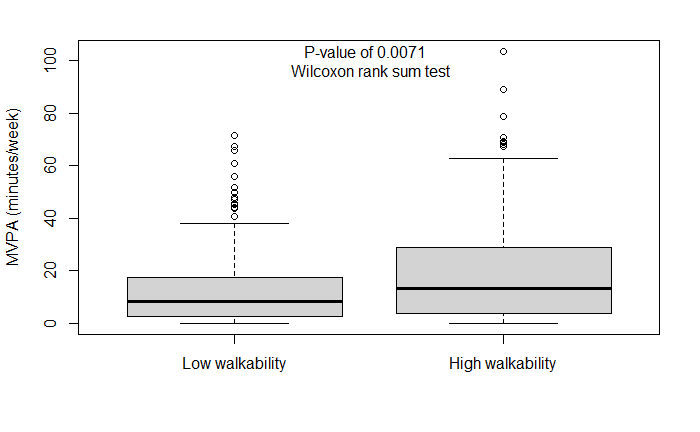
Create the following boxplot by using the str() function and the $ to select the p-value from the result of the Wilcoxon test and save it as the R object p_wilcoxon: