First, our desired scales are in log-scale. This is not the default, so
this change needs to be added through a scales layer. A quick look at
the cheat sheet reveals the scale_x_continuous function lets us
control the behavior of scales. We use them like this:
p + geom_point(size = 3) +
  geom_text(nudge_x = 0.05) +
  scale_x_continuous(trans = "log10") +
  scale_y_continuous(trans = "log10")
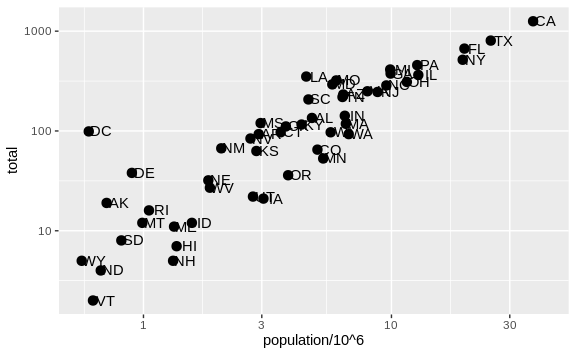
Because we are in the log-scale now, the nudge must be made smaller.
This particular transformation is so common that ggplot2 provides
the specialized functions scale_x_log10 and scale_y_log10, which we
can use to rewrite the code like this:
p + geom_point(size = 3) +
  geom_text(nudge_x = 0.05) +
  scale_x_log10() +
  scale_y_log10()