In the search for extraterrestrial life, various methods are used to identify inhabitable planets in other star systems (so-called exoplanets or extrasolar planets). The most simple way to identify habitable exoplanets is based on the concept of the habitable zone (IZ) around stars. The IZ can be used as a yes-or-no criteria, where exoplanets are either habitable or not. However, it is clear that some exoplanets have a larger chance of being inhabited than others. Therefore, more advanced metrics are needed, such as distance to habitable zone (IZD), that can be used for example to order the over 600 exoplanets that are already confirmed to be habitable. Moreover, there are thousands of exoplanets that are waiting for confirmation of their status, and many more are likely to be discovered in the future. Procedures for ordering and classifying habitable exoplanets do not only help to prioritize observations, but also to compare results.
The IZ is usually defined by the area surrounding a star where fluid water can occur on the surface of a planet (Karsting et al., 1993), since this is an important requirement for the development of life as we know it. Within the IZ, smaller celestial bodies are not able to grip an atmosphere, while the atmosphere in which gigantic planets are captured in giant planets, causing them to compress every form of water in to ice. It is necessary that exoplanets have earthly measurements (between half and twice the intersection of the earth) to be declared potentially habitable. Exoplanets that are closer to their star, will lose all water to space and those that are further away will freeze. The IZ is the good area to search for habitable planets, with a width of about 0.3 AU for weak stars such as those with stellar classification M (red dwarfs) and up to 2 AU for bright stars such as those with stellar classification F.
The IZ is defined in function of the stellar brightness and some other critical properties of stars (Karsting et al., 1993). A conservative approach for constructing the IZ uses a "recent Venus" model as boundary $$r_{is}$$ for the inner radius and an "early Mars" model as boundary $$r_{os}$$ for the outer radius (Underwood et al., 2003; Selsis et al. 2007). Other boundaries that are typically used are given in the below table.
| model | ID | $$r_{is}$$ | $$r_{os}$$ |
|---|---|---|---|
| Mars-Venus (default model) | 0 | 0,72 | 1,77 |
| 0% clouds | 1 | 0,84 | 1,67 |
| 50% clouds | 2 | 0,68 | 1,95 |
| 100% clouds | 3 | 0,46 | 2,40 |
The inner $$r_i$$ and outer $$r_o$$ radius of the IZ (in AU) is given by \[ \begin{array}{rcl} r_i & = & \left( r_{is} - a_i (T_\text{eff} - T_\text{s}) - b_i (T_\text{eff} - T_\text{s})^2 \right) \sqrt{L} \\ r_o & = & \left( r_{os} - a_o (T_\text{eff} - T_\text{s}) - b_o (T_\text{eff} - T_\text{s})^2 \right) \sqrt{L} \end{array} \] where $$L$$ represents the stellar brightness (expressed relatively in relation to the luminosity of the sun), $$T_\text{eff}$$ is the actual temperature of the star (in Kelvin), $$T_\text{s} = 5700\,\text{K}$$, $$a_i = 2,7619 \times 10^{-5}$$, $$b_i = 3,8095 \times 10^{-9}$$, $$a_o = 1,3786 \times 10^{-4}$$ en $$b_o = 1,4286 \times 10^{-9}$$. Exoplanets are declared habitable if the mean distance to their stars is within these two boundaries.
Wherever the IZ around a star gives a yes-or-no-answer to the question if the exoplanet is habitable, the IZ is converted to an analogue scale by the IZD. For this conversion, the distance of the exoplanet to the middle of the IZ is calculated. The distance is then normalized with half the width of the IZ. The IZA is thereby given by the formula \[ BZA = \frac{2r - r_o - r_i}{r_o - r_i} \] with $$r$$ representing the distance from the exoplanet to its star (expressed in AU). The advantage of the IZD is that the resulting values can easily be compared with the different star systems, because they always mean the same. IZD values that are between -1 and +1, always correspond to planets that are remote from the star (cold zone). An IZD that is equal to zero, corresponds with the center of the IZ. Do note that this does not necessarily imply that an exoplanet that is closer to the center of the IZ would we more habitable than an exoplanet that is further away from the center, but still within the IZ, since being habitable also depends on other properties of the planet.
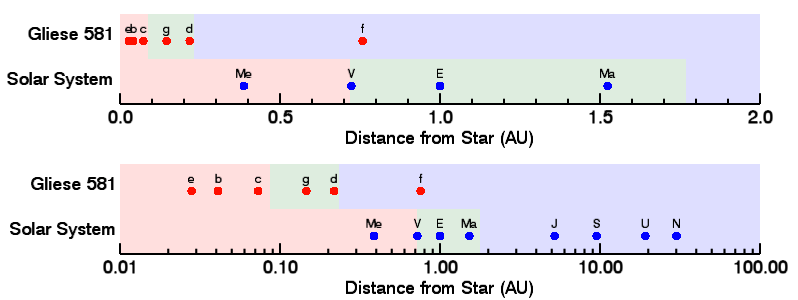
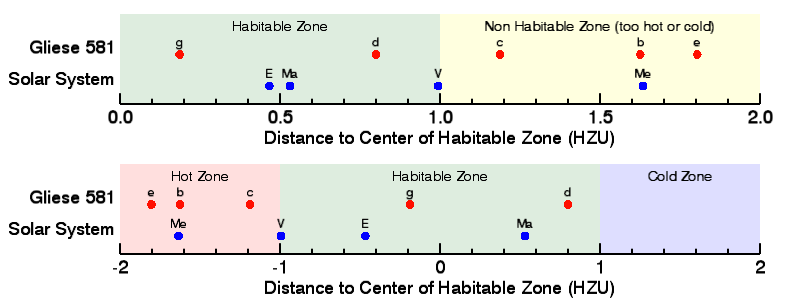
As an example, we will compare the exoplanets of the star Gliese 581 with those from our own solar system (Image 1). Gliese 581 is a red dwarf with four confirmed exoplanets that orbit the star in less than 1 AU. In this example, however, we use the six-planet-solution that was proposed by Vogt et al. (2010). The IZD was calculated on the basis of the above formulas. In the upper pannel of Image 2, we use the absolute value of the IZD to sort the exoplanets on the basis of how habitable they are. The closer the value is to zero, the better the exoplanet can be inhabited. In this comparison it is also important to look at the sign of the IZD (lower frame of Image 2). Candidates with an IZD just below -1 (hot zone) can be ignored as habitable exoplanets, since these probably resemble Venus a lot. Values that are just above +1, however, might be interesting if there would be severe greenhouse effects.

Image 1. Comparison
of the distance from the star Gliese 581 to its exoplanets (red dots)
with the distance between our sun and the planets of our solar system
(blue dots). Because of the clearness, only the earthly planets are
given on the linear axis of the upper panel, and the gas giants are used
as a reference on the logarithmic axis of the lower pannel. the green
areas indicate the habitable zone in both cases. Red areas indicate the
hot zone and blue areas indicate the cold zone. On this distance, it is
harder to compare how to order the planets in comparison with their
habitable zones.

Image 2. Distance to the center of the habitable zone (IZD) of the exoplanets of Gliese 581 (red dots) in comparison with the planets of our solar system (blue dots) The upper pannel uses the absolute value of the IZD, while the lower panel uses the IZD value itself. The green areas indicate the habitable zones in both cases. The red areas indicate the hot zone and the blue areas indicate the cold zone. The yellow area combines the hot and cold zone. Note that Gliese 581 c (IZD = -1.2) can be catalogued as less habitable than Venus (IZD = -1.0) and that Gliese 581 g (IZD = -0.2) seems more habitable than the Earth (BZA ~ -0.5). Only 2 IZD units sufficed to represent all exoplanets, except for Gliese 581 f, and all earthly planets, the other cases are outside the scale.
Sources
-
Kasting JF, Whitmire DP, Reynolds RT (1993). Habitable zones around main sequence stars. Icarus 101, 108-108.
-
Schulze-Makuch D, Méndez A, Fairén AG, von Paris P, Turse C, Boyer G, Davila AF, Resendes de Sousa António M, Irwin LN, Catling D (2011). A Two-Tiered Approach to Assess the Habitability of Exoplanets. Astrobiology 11(10), 1041-1052.
-
Selsis F, Kasting J, Levrard B, Paillet J, Ribas I, Delfosse X (2007). Habitable planets around the star Gliese 581? A&A 476, 1373-1387.
-
Underwood DR, Jones BW, Sleep PN (2003). The evolution of habitable zones during stellar lifetimes and its implications on the search for extraterrestrial life. Int. J. of Astrobiology 2(4), 289-299.
-
Vogt SS, Butler RP, Rivera EJ, Haghighipour N, Henry GW, Williamson MH (2010). The Lick-Carnegie Exoplanet Survey: A 3.1 M Planet in the Habitable Zone of the Nearby M3V Star Gliese 581. The Astrophysical Journal 723, 954.
Assignment
The HEC Full Database of Exoplanets contains observed and modeled parameters for the current list of confirmed exoplanets and NASA Kepler candidates. This databank can be downloaded in comma separated value (CSV) format. This format can be read by Microsoft Excel and most scientific analyses software. An overview of the meaning of the different columns in this CSV can be found here.
-
Write a function IZ(L[, Teff][, model]) that calculates the habitable zone of a star. The luminocity $$L$$ of the star (relative in relation to the sun) must be passed to the function as a mandatory parameter. The function also takes two optional parameters: the effective temperature $$T_\text{eff}$$ of the star (in Kelvin; default value $$5700\,\text{K}$$) and the identifier of the model that determines the boundaries $$r_{is}$$ en $$r_{os}$$ (default value 0). Because of the restrictions of the estimate of the habitable zone, the effective temperature $$T_\text{eff} = 3700\,\text{K}$$ must be used, if an effective temperature is passed that is lower than $$3700\,\text{K}$$. The function must print the boundaries $$r_i$$ and $$r_o$$ of the IZ as the tuple $$(r_i, r_o)$$.
-
Use the function IZ(r, L[, Teff][, model]) to write a function IZD that prints the distance of a planet to the center of the habitable zone to its star. The distance $$r$$ of a planet to its star must be passed as a first, obligatory argument to this function. Furthermore, the function takes the same obligatory ($$L$$) and optional ($$T_\text{eff}$$ and a modelidentifier) parameters as the function IZ.
-
Write a function habitablePlanets(file[, star][, model]) that can be used to print a neatly drawn up overview list of habitable planets. habitable planets are planets for which $$-1 < \text{BZA} < 1$$. The overview list must contain the following information, where the expected layout is indicated:
-
name of the star to which the exoplanet belongs (aligned left over 14 positions)
-
luminosity $$L$$ of the star (real number with 3 digits after the decimal full stop, aligned right over 8 positions)
-
effective temperature $$T_\text{eff}$$ of the star (integer, aligned right over 6 positions)
-
inner boundary $$r_i$$ of the habitable zone (real number with 3 digits after the decimal full stop, aligned right over 8 positions)
-
outer boundary $$r_o$$ of the habitable zone (real number with three digits after the decimal full stop, aligned right over 8 positions)
-
two spaces
-
name of the exoplanet (aligned left over 16 positions)
-
distance $$r$$ from the exoplanet to its star (real number with 3 digits after the decimal full stop, aligned right over 8 positions)
-
IZD of the exoplanet (real number with 3 digits after the decimal full stop, aligned right over 8 positions)
Remark: if the CSV file does not contain a value for the distance ($$r$$), luminosity ($$L$$) or temperature ($$T_\text{eff}$$) that you need for the calculation of the IZD, this planet must not be printed in the overview of habitable planets. -
Example
In the interactive Python session below, we assume that the CSV file exoplanets.csv is in the current directory.
>>> IZ(1.0)
(0.72, 1.77)
>>> IZ(0.012, 3498)
(0.08325382874078525, 0.2234714169113722)
>>> IZ(0.012, 3498, 3)
(0.05477225575051661, 0.29248445915702315)

>>> IZD(1.0, 1.0)                     # Earth
-0.4666666666666666
>>> IZD(1.524, 1.0)                   # Mars
0.5314285714285715
>>> IZD(0.210, 0.012, 3498)           # Gliese 581 d
0.8078498270133836

>>> habitablePlanets('exoplanets.csv', star='Gl')
Gl 581           0.012  3498   0.084   0.224  Gl 581 d           0.210   0.797
Gliese 876       0.015  3350   0.092   0.247  Gliese 876 b       0.210   0.524
Gliese 876       0.015  3350   0.092   0.247  Gliese 876 c       0.130  -0.509
>>> habitablePlantes('exoplanets.csv', star='Gliese')
Gliese 876       0.015  3350   0.092   0.247  Gliese 876 b       0.210   0.524
Gliese 876       0.015  3350   0.092   0.247  Gliese 876 c       0.130  -0.509