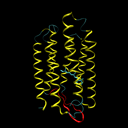
Bacteriorhodopsine is a 7-transmembrane protein, which means that it is built from seven helices that cross the cell membrane (see the left figure below). As a consequence, this protein must consist of seven hydrophobic (water resistant) segments that don't react with the greasy cell membrane, alternating with the hydrophylic segments that don't react with the watery cytoplasm and the environment outside the cell. To every amino acid of a protein, a gradation of hydrophobicity can be appointed, ranging from very hydrophobic to very hydrophilic. The table underneath (right) gives the hydrophobicity values for various amino acids (positive values are hydrophobic and negative values are hydrophylic) as they were determined by Kyte and Doolittle1.

| residue | value |
|---|---|
| A | 1.8 |
| R | -4.5 |
| N | -3.5 |
| D | -3.5 |
| C | 2.5 |
| Q | -3.5 |
| E | -3.5 |
| G | -0.4 |
| H | -3.2 |
| I | 4.5 |
| residue | value |
|---|---|
| L | 3.8 |
| K | -3.9 |
| M | 1.9 |
| F | 2.8 |
| P | -1.6 |
| S | -0.8 |
| T | -0.7 |
| W | -0.9 |
| Y | -1.3 |
| V | 4.2 |
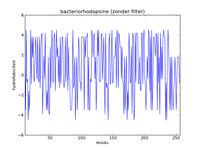
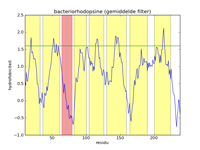
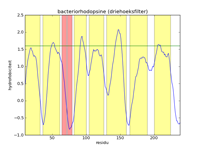
The left figure below gives a picture of the list with data points that represent the hydrophobicity values of bacteriorhodopsine. A hydrofobicity value gives the chance a certain amino acid occurs in a hydrophobic region. However, it is not an exact prophecy. An amino acid with a high hydrophobicity can still occur in water, and vice versa. Because of this the signal contains a lot of noise, and it is almost impossible to find hydrophobic regions in this figure. By applying a mathematical filter technique, the noise can be suppressed. In the middle figure, for example, a mean filter was used, and the seven helices are indicated with yellow strips. Here we can obviously see that the filtering strengthens the signal, and the peaks of high hydrophobicity can clearly be linked to the regions where the helices are. The right-hand figure is analogous to the middle figure, but uses a triangle filter. The effect is that the signal is further strengthened.


Assignment
Write a function hydrophobicity to which two obligatory arguments must be given: a protein sequence (string consisting of letters representing amino acids) and a dictionary that maps each amino acid onto a corresponding hydrophobicity value. The function must return a list with the hydrophobicity values of the consecutive amino acids of the protein sequence.
Suppose we possess a list of data points we represent as $$x_0, x_1, \ldots, x_n$$. A filter consists of a list of weights $$w_0, w_1, \ldots, w_m$$ (with $$m$$ even and $$m \leq n$$). By applying the filter to a list of data points we obtain a new (flattened) list of data points $$y_0, y_1, \ldots y_{n-m}$$, of which the values are calculated as follows
\[ y_i = \frac{\displaystyle\sum_{j=0}^m w_j x_{i+j}}{\displaystyle\sum_{j=0}^m w_j},\ 0 \leq i \leq n-m \] Write a function filter to which two arguments must be given: a list of data points and a list of weights. The data points and the weights are integers. The function must print a flattened list of data points that is the result after applying the filter to the original list of data points.If all weights of the filter have the same value $$w$$ ($$w \neq 0$$), the filter calculates the average of the value of a data point and a number of neighbouring points right and left from that point. If we use the list [1, 1, 1, 1, 1] as a filter, for example, 5 points are leveled out (one point and two points left and right). We name this an average filter with width $$b = 5$$. Analogously, an average filter with width $$b = 7$$ uses the list [1, 1, 1, 1, 1, 1, 1]as a filter. Use the function filter to write a function filterAverage to which an obligatory list of data points (argument datapoints) and optionally a width $$b$$ (argument width; use $$b=5$$ as a standard value) must be given. This function must return the flattened list of data points that results after applying an average filter with width $$b$$ as a result. If the given width $$b$$ is even, the function must increase by 1 (the width must always be uneven).
A triangle filter uses a filter that increases from 1 in the first half, and starts decreasing halfway. For example, the triangle filter with width $$b=5$$ uses the filter [1, 2, 3, 2, 1], a triangle filter with width $$b=7$$ uses the filter [1, 2, 3, 4, 3, 2, 1], and so on. Use the function filter to write a function filterTriangle to which an obligatory list of data points (argument datapoints) and an optional width $$b$$ (argument width; use $$b=5$$ as a standard value) must be given. This function must return the flattened list of data points that results after applying a triangle filter with width $$b$$. If the given width $$b$$ is even, the function must increase by 1 (the width must always be uneven).
Example
>>> protein = 'AQITGRPEWI'
>>> kd = {
...     'A': 1.8, 'R':-4.5, 'N':-3.5, 'D':-3.5, 'C': 2.5,
...     'Q':-3.5, 'E':-3.5, 'G':-0.4, 'H':-3.2, 'I': 4.5,
...     'L': 3.8, 'K':-3.9, 'M': 1.9, 'F': 2.8, 'P':-1.6,
...     'S':-0.8, 'T':-0.7, 'W':-0.9, 'Y':-1.3, 'V': 4.2
... }

>>> datapoints = hydrophobicity(protein, kd)
>>> datapoints
[1.8, -3.5, 4.5, -0.7, -0.4, -4.5, -1.6, -3.5, -0.9, 4.5]

>>> filterAverage(datapoints)
[0.34, -0.92, -0.54, -2.14, -2.18, -1.2]
>>> filterAverage(datapoints, width=5)
[0.34, -0.92, -0.54, -2.14, -2.18, -1.2]

>>> filterTriangle(datapoints, width=3)
[-0.175, 1.2, 0.675, -1.5, -2.75, -2.8, -2.375, -0.2]