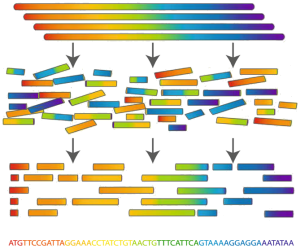
Determining an organism's complete genome (called genome sequencing) forms a central task of bioinformatics. Unfortunately, we still don't possess the microscope technology to zoom into the nucleotide level and determine the sequence of a genome's nucleotides, one at a time. However, researchers can apply chemical methods to generate and identify much smaller snippets of DNA, called reads. After obtaining a large collection of reads from multiple copies of the same genome, the aim is to reconstruct the desired genome from these small pieces of DNA. This process is called genome assembly.

From a computational perspective, genome assembly is an extremely difficult problem. It becomes even harder, because many of the genomes contain large numbers of identical sequences that are repeated at various locations in the genome. Such repetitions often stretch over thousands of nucleotides, and some are found at thousands of different positions across the genome. This especially occurs in the large genomes of plants and animals. As a result, it is often impossible to reconstruct the complete genome and the assembly process ends with a number of large pieces of the genome which are called contigs in this context.
Assignment
To determine the quality of a genome assembly (for example, when comparing two different assembly algorithms that separately have computed contigs starting from the same set of reads), the N50 statistic is often used.
Suppose that after assembly of a genome of length $$g$$ we obtain a sequence of contigs, and that we sort the lengths of these contigs in decreasing order. We then start adding the lengths (in decreasing order). The first length that causes the sum to become larger or equal to $$\frac{g}{2}$$ (half the length of the genome) gives the first approximation of the N50 statistic. A second approximation is obtained by applying a similar procedure, where the lengths of the contigs are added in an increasing order. The N50 statistic is then computed as the mean of both approximations. In some cases the length of the genome is unknown, in which case the sum of all contig lengths is used as an estimate for the genome length $$g$$.
For example, consider the list of contig lengths $$[2, 2, 2, 3, 3, 4, 8, 8]$$. We can estimate the genome length as $$2 + 2 + 2 + 3 + 3 + 4 + 8 + 8 = 32$$. For this example, the first approximation of the N50 statistic (decreasing order) gives the value 8, because $$8 + 8 = 16 \geq \frac{32}{2}$$. The second approximation (increasing order) gives the value 4, since $$2 + 2 + 2 + 3 + 3 + 4 = 16 \geq \frac{32}{2}$$. Based on both approximations, we can calculate the N50 statistic as $$\frac{8 + 4}{2}$$ = 6.
Your task:
Write a function N50_decreasing that takes a collection (list, tuple, collection, …) of integers. These integers represent the lengths of the contigs obtained after genome assembly. The function also has a second optional parameter size to which the genome size can be passed. If no value is passed to this parameter, the sum of the given contig lengths is used as an estimate of the genome size. The function must return the approximation of the N50 statistic (as an integer) that is obtained if the procedure described above is applied with the contig lengths added in decreasing order.
Write a function N50_increasing that takes same parameters as the function N50_decreasing, with the same meaning. The function must return the approximation of the N50 statistic (as an integer) that is obtained if the procedure described above is applied with the contig lengths added in increasing order.
Use the functions N50_decreasing and N50_increasing to write a function N50 that has the same parameters as the previous two functions, with the same meaning. The function must return the N50 statistic of the given collection of contig lengths as a floating point number.
Example
>>> contigs = (2, 2, 2, 3, 3, 4, 8, 8)
>>> N50_decreasing(contigs)
8
>>> N50_increasing(contigs)
4
>>> N50(contigs)
6.0

>>> contigs = (5, 8, 6, 4, 6, 1, 1)
>>> N50_decreasing(contigs, size=40)
6
>>> N50_increasing(contigs, size=40)
6
>>> N50(contigs, 40)
6.0