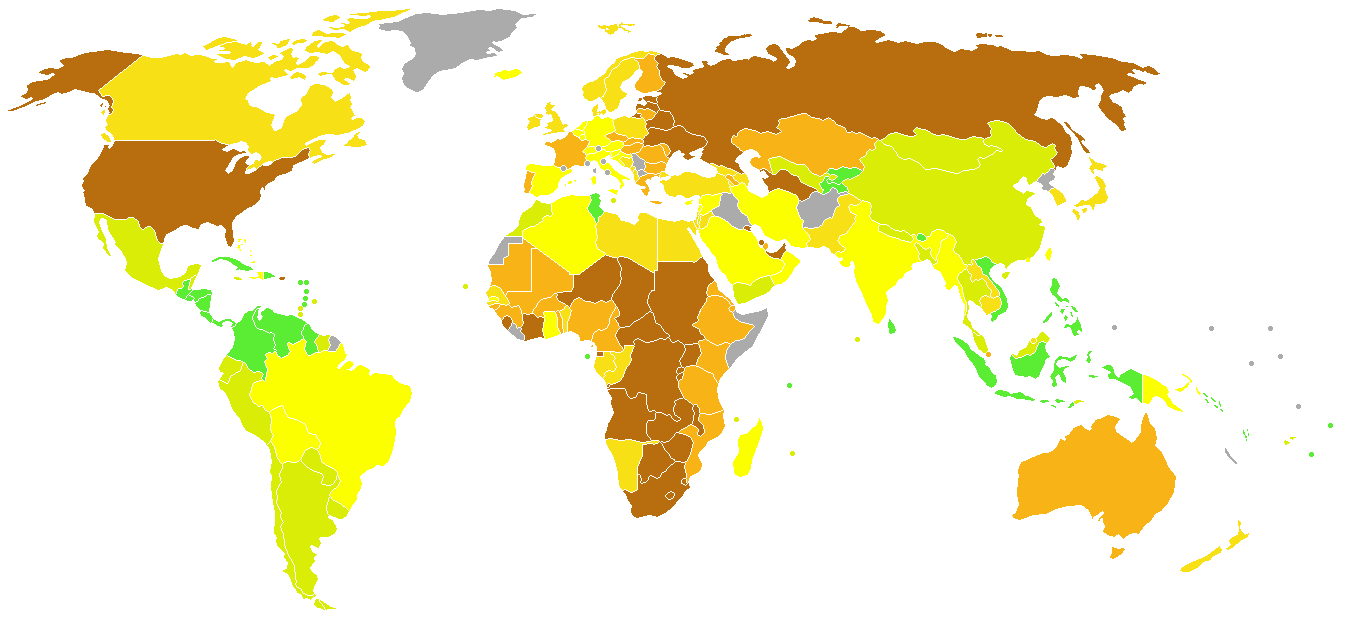
There is a growing global consensus that we need new measures of progress. It is critical that these measures clearly reflect what we value — something the current approach fails to do. The Happy Planet Index (HPI) measures what really matters. It tells us how well nations are doing in terms of supporting their inhabitants to live good lives now, while ensuring that others can do the same in the future, i.e. sustainable well-being for all.
In its 2012 report the New Economics Foundation reveals that this is largely still an unhappy planet — with both high- and low-income countries facing many challenges on their way to meeting this same overall goal. But it also demonstrates that good lives do not have to cost the Earth — that the countries where well-being is highest are not always the ones that have the biggest environmental impact.

The HPI is one of the first global measures of sustainable well-being. It uses global data on experienced wellbeing, life expectancy, and ecological footprint to generate an index revealing which countries are most efficient at producing long, happy lives for their inhabitants, whilst maintaining the conditions for future generations to do the same. \[\text{HPI} = \frac{\text{well-being} \times \text{ life expectancy}}{\text{ecological footprint}}\] At heart, the HPI is a measure of efficiency. It calculates the number of Happy Life Years achieved per unit of resource use. This simple headline indicator gives a clear sense of whether a society is heading in the right direction. It provides a vital tool for policymakers to ensure fundamental issues are accounted for in crucial policy decisions.
Input
The first line of input contains the name of a country. The following three lines each contain a floating point number. These numbers respectively give the experienced well-being, the average life expectancy, and the ecological footprint of the country.
Output
There's a single line of output that contains the sentence The HPI of country is hpi., where the italic fragments need to filled up with values derived from the input values. The placeholder country needs to be filled up with the name of the country. The placeholder hpi needs to be filled up with the computed HPI of the country. This value must be formatted as a floating point number with two decimal digits. Rounding must be used to determine the decimal digits.
Example
Input:
Belgium
6.9
80.0
7.1
Output:
The HPI of Belgium is 77.75.Example
Input:
Germany
6.7
80.4
4.6
Output:
The HPI of Germany is 117.10.