Social Network Learning: Plotting
In this exercise, we will explore how to infer the behavior of nodes in a social network based on the behavior of their neighboring nodes. This process is known as social network learning.
Setting Up
Before we begin, we need to load the igraph package for plotting.
If you haven’t installed it yet, the following code will do it for you:
if (!require(igraph)){
  install.packages("igraph",
                   repos="https://cran.rstudio.com/",
                   quiet=TRUE)}
require(igraph)
Note: Make sure that the statnet package is unloaded to avoid naming conflicts!
Creating a Network
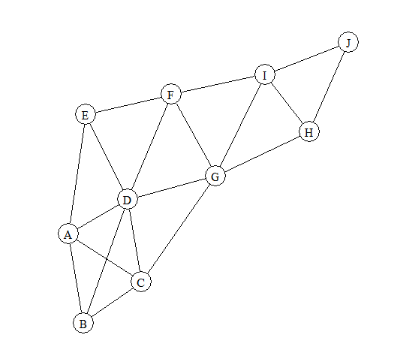
Consider the following network of customers of a bank. Each row in the data frame represents a connection between two customers:
BankNetwork <- data.frame(
  from = c('A', 'A', 'A', 'A', 'B', 'B', 'C', 'C', 'D', 'D', 'D', 'E',
           'F', 'F', 'G', 'G', 'H', 'H', 'I'),
  to = c('B','C','D','E','C','D','D', 'G','E', 'F','G','F','G','I',
         'I','H','I','J','J'))
| FROM | TO |
|---|---|
| A | B |
| A | C |
| A | D |
| A | E |
| B | C |
| B | D |
| C | D |
| C | G |
| D | E |
| D | F |
| D | G |
| E | F |
| F | G |
| F | I |
| G | I |
| G | H |
| H | I |
| H | J |
| I | J |
Plotting the Network
We can convert this data frame into a graph object using the graph_from_data_frame() function:
g <- graph_from_data_frame(BankNetwork, directed = FALSE)
The igraph package provides several functions for plotting networks.
Here’s how you can create a basic plot of the network:
plot.igraph(
  g,
  edge.label = NA,
  edge.color = 'black',
  layout = layout_nicely(g),
  vertex.label = V(g)$name, vertex.color = 'white',
  vertex.label.color = 'black'
)
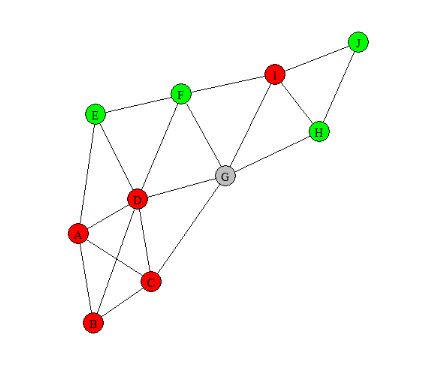
Adding Node Attributes
Node attributes can be used to add additional information to the nodes in the network. For example, we can add a “churn” attribute to indicate whether a customer has churned (1) or not (0): Now, each churn label can have its own color on the graph.
V(g)$churn <- c(1,1,1,1,0,0,NA,0,1,0)
V(g)$color <- ifelse(
  is.na(V(g)$churn),
  'grey',
  ifelse(V(g)$churn == 1 , 'red', 'green')
)
plot.igraph(
  g,
  edge.label = NA,
  edge.color = 'black',
  layout = layout_nicely(g),
  vertex.label = V(g)$name, vertex.color = V(g)$color,
  vertex.label.color = 'black'
)
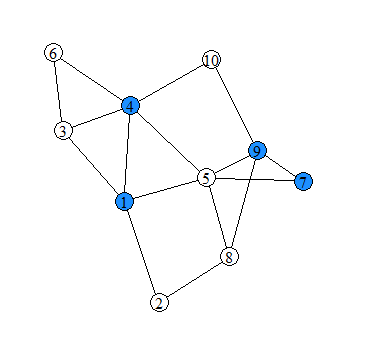
Exercise
Consider the network of padel players of a padel club.
Code to following network into PadelNetwork and store the graph in n.
Try to code the gender as well as the color of the nodes as node attributes.
The blue nodes are men (coded as 1) and the white ones are women (coded as 0).
Note that you should use the ‘dodgerblue’ color in R instead of the normal 'blue' color.
Assume that:
- The igraph library has been loaded.