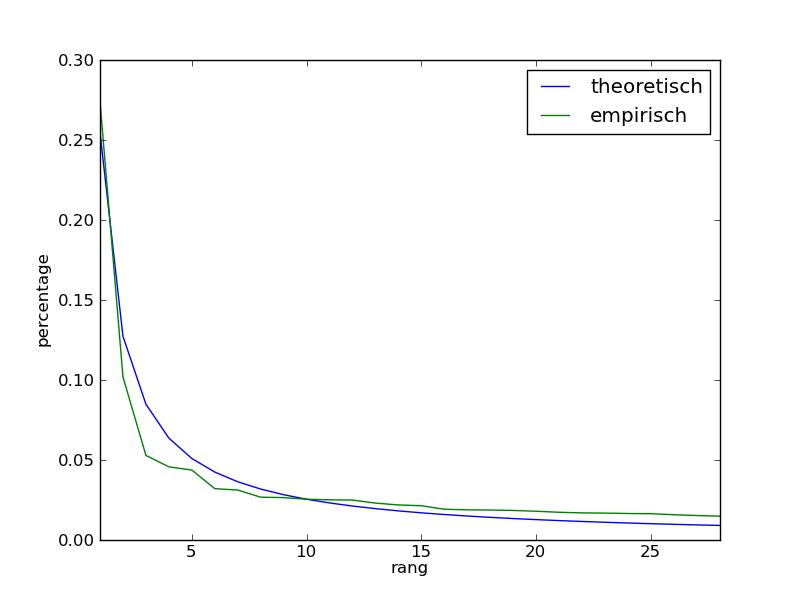
Zipf's law, a remarkable regularity in distribution, states that given some corpus of natural language utterances, the frequency of any word is inversely proportional to its rank in the frequency table. Thus the most frequent word will occur approximately twice as often as the second most frequent word, three times as often as the third most frequent word, etc. However, this law can also be found outside of linguistics. By now it has been shown that a generalization of Zipf's Law also applies to a lot of other data sets. For example, the distribution of population over the cities in a country seems to follow Zipf's Law to a certain extent, as illustrated below for the population of the 28 largest cities in France.

In its general form Zipf's law can be described as follows. A distribution follows Zipf's law if the $$n$$-th part of the distribution (if the distribution is arranged from large to small) contains the percentage $$p(n, \lambda, N)$$ of the total. Here $$N$$ is the total amount of parts in the distribution and $$\lambda$$ is a parameter that equals 1 in the original version of Zipf's law. The percentage $$p(n, \lambda, N)$$ is given by the formula below: \[ p(n, \lambda, N) = \frac{1}{\sum_{k=1}^Nk^{-\lambda}}n^{-\lambda} \]
Assignment
Write a function zipf that returns the theoretical percentage that should be in the $$n$$-th part of a distribution in $$N$$ parts if a Zipfian distribution applies with a parameter $$\lambda$$. The values for $$n$$ and $$N$$ must be passed as an argument to the function and the value for $$\lambda$$ can be passed as well with a default value equal to 1.
Write a function readData that takes the location of a text file as a first mandatory argument. All lines of this text file must contain an equal number of information fields that are separated by a single dash. The function should return a list of integer values, that contains the values from the given column of the text file. This column (field numbers are counted from 1) must be passed on as a second obligatory argument. If the given field of the text file contains real numbers, then these have to be rounded off to the closest integer value. Optionally, a third argument can be passed to the function: the dash that is used to separate the information fields in the text file. Use a tab as the default value for this optional argument.
Write a function testZipf that can be used to check if a given list of integer values (that is passed to the function as an argument) meets Zipf's law with a certain parameter $$\lambda$$ (which can be passed as argument with name 1 and default value 1). For each $$n$$-th part of the list the function must print the number $$n$$ on a separate line (right aligned over the maximum of positions necessary to print the length of the list), followed by the amount in the $$n$$-th part (right aligned over 6 positions), the theoretical percentage $$p(n, \lambda, N)$$ and the percentage of $$n$$-th part in the given list. Both percentages are right aligned over 10 positions, and are rounded off to four decimal places.
Example
The following interactive Python session uses the file france.txt. This is the text file that consists of two columns (separated by a tab): i) the name and ii) the number of inhabitants (per thousand) of a city in France.
>>> zipf(1, 28)
0.25463622288862675
>>> zipf(2, 28, 3)
0.1040416849914885

>>> cities = readData('france.txt', 2)
>>> cities
[124, 132, 141, 210, ..., 359, 130, 117]

>>> testZipf(cities)
 1  2152    0.2546    0.2741
 2   800    0.1273    0.1019
 3   415    0.0849    0.0529
 4   359    0.0637    0.0457
 5   343    0.0509    0.0437
 6   252    0.0424    0.0321
 7   245    0.0364    0.0312
 8   210    0.0318    0.0267
 9   208    0.0283    0.0265
10   200    0.0255    0.0255
11   197    0.0231    0.0251
12   196    0.0212    0.0250
13   181    0.0196    0.0231
14   172    0.0182    0.0219
15   168    0.0170    0.0214
16   151    0.0159    0.0192
17   148    0.0150    0.0189
18   147    0.0141    0.0187
19   145    0.0134    0.0185
20   141    0.0127    0.0180
21   136    0.0121    0.0173
22   133    0.0116    0.0169
23   132    0.0111    0.0168
24   130    0.0106    0.0166
25   129    0.0102    0.0164
26   124    0.0098    0.0158
27   120    0.0094    0.0153
28   117    0.0091    0.0149
Example
The following interactive Python session uses the file belgium.txt. This is the text file that consists of three columns (separated by a tab): i) the name of a city in Belgium ii) the number of inhabitants (per thousand) of the city and iii) the number of inhabitants (per thousand) of the corresponding agglomeration.
>>> belgium_cities = readData('belgium.txt', 2, ',')
>>> print(belgium_cities)
[470, 92, 117, 136, 207, 231, 76, 197, 104]
>>> testZipf(belgium_cities, 0.77)
1   470    0.2849    0.2883
2   231    0.1671    0.1417
3   207    0.1223    0.1270
4   197    0.0980    0.1209
5   136    0.0825    0.0834
6   117    0.0717    0.0718
7   104    0.0637    0.0638
8    92    0.0575    0.0564
9    76    0.0525    0.0466
>>> belgium_suburbs = readData('belgium.txt', 3, ',')
>>> print(belgium_suburbs)
[668, 175, 117, 960, 295, 251, 114, 485, 104]
>>> testZipf(belgium_suburbs, l=0.84)
1   960    0.3052    0.3029
2   668    0.1705    0.2108
3   485    0.1213    0.1530
4   295    0.0953    0.0931
5   251    0.0790    0.0792
6   175    0.0678    0.0552
7   117    0.0595    0.0369
8   114    0.0532    0.0360
9   104    0.0482    0.0328