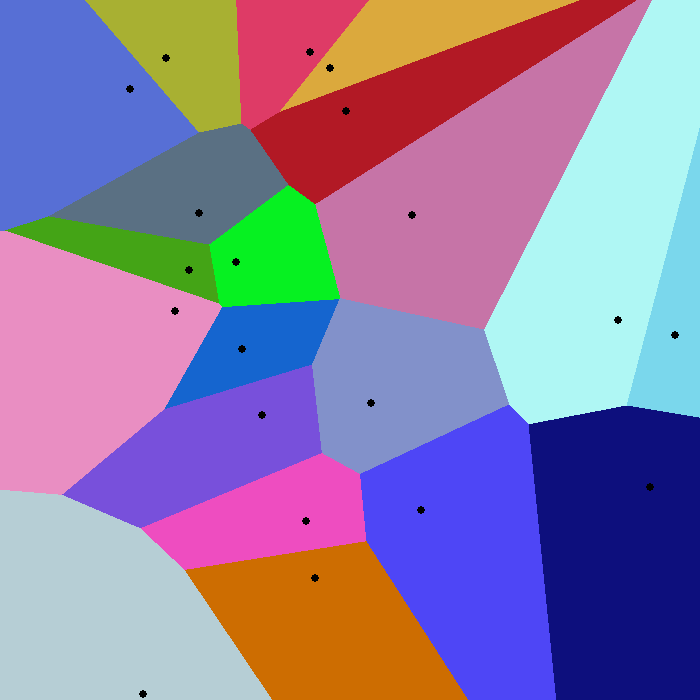
If a lion hunts a herd of antelope, what rules govern the herd's behavior? One intriguing possibility is known as selfish herd theory1: rather than acting to benefit the group as a whole, each member positions itself so that there's at least one other animal between it and the predator. This produces a pattern known as a Voronoi tessellation2 — if each dot in the diagram below is an antelope, then the surrounding colored region is the area that is closer to that antelope than to any of its neighbors. If a lion enters your cell, then you're the antelope that is going to get eaten.

This understanding helps to explain some herd behavior. Each animal wants to make its domain of danger as small as possible and to be as far as possible from the predator. Dominant animals tend to get prime positions near the center, subordinate animals get pushed to the fringes, and the whole formation evolves continuously as predator and prey move about.

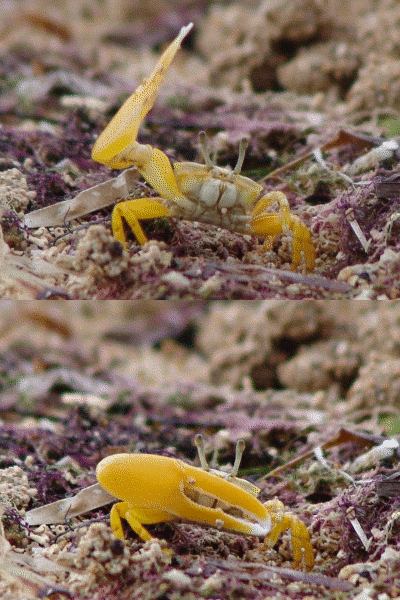
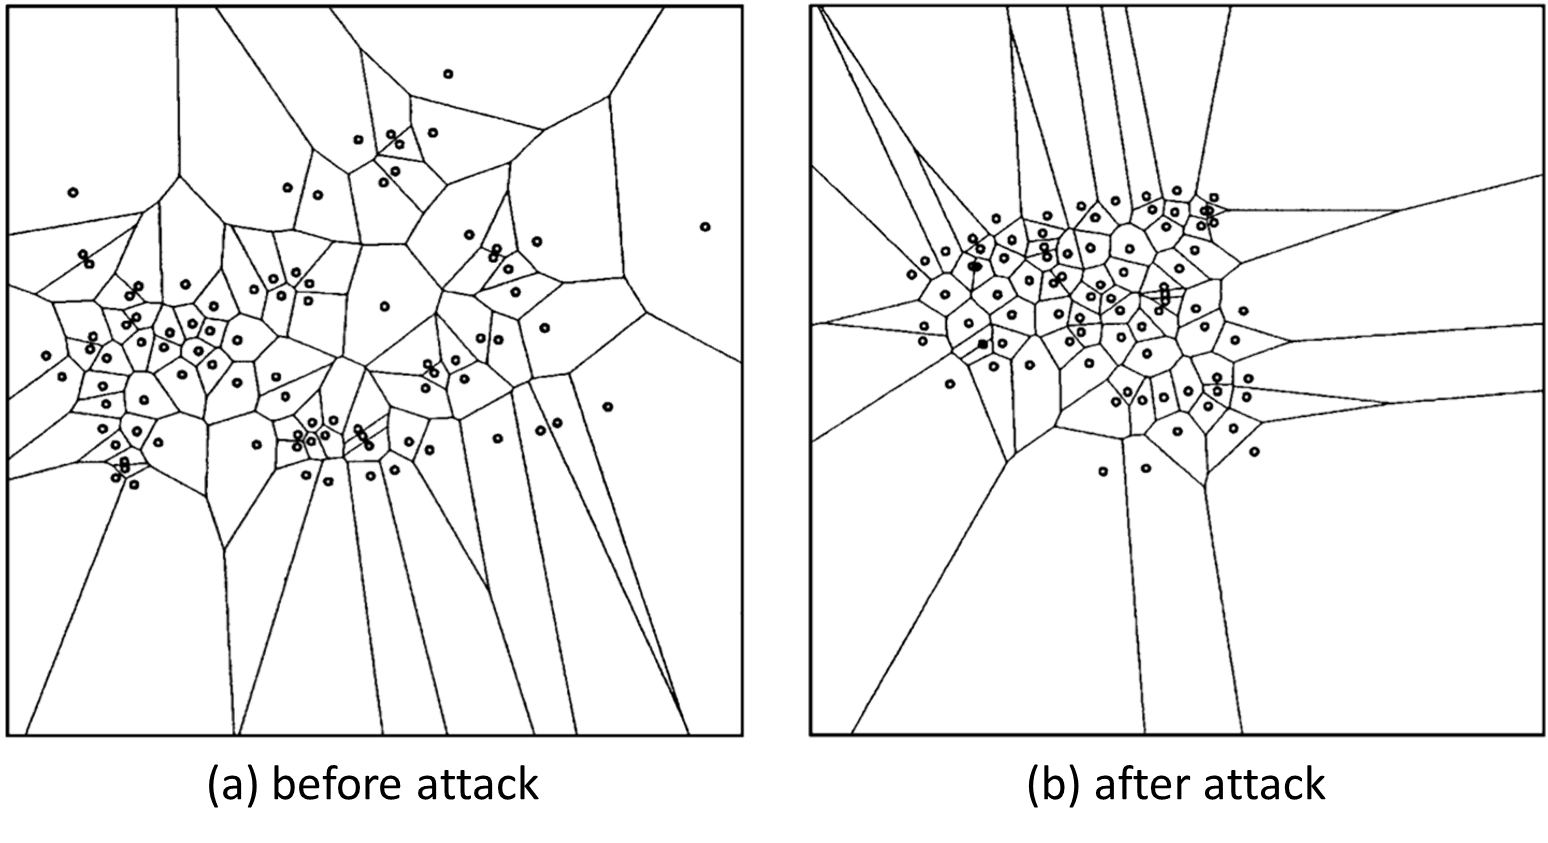
Studies have shown that groups of fiddler crabs3 tend to take up Voronoi patterns fairly quickly when a predator first appears, and to huddle together when the danger increases as each tries to reduce its surrounding polygon. This actually leads some to move toward the predator as they try to reach the center and put others between the hunter and themselves. Those that violate the movement rules tend to get picked off, which reinforces the evolutionary strength of the strategy.

Assignment
Consider a rectangular area in which a herd of antelope is grazing. We divide the area into cells that form a rectangular grid, so that each cell contains at most one antelope. The cells of the grid where an antelope is grazing are marked with a unique capital letter, the other cells are marked with a dot. As such, the positions of the antelope in the area can be represented by a map that takes the following form:
......B..
.........
...A.....
.........
.......D.
.........
.C.......
.....E...
.........
The position of a cell in the grid is represented by a tuple $$(r, c)$$, where $$r$$ (int) is the row index and $$c$$ (int) the column index of the cell in the grid. The rows in the grid are indexed top to bottom and the columns left to the right, starting from 0 in both cases.
Your task is to divide the area into regions around each of the antelope according to a Voronoi tessellation. The region around an antelope consists of the cell where the antelope is grazing, along with all other cells that are closer to that antelope than to any other antelope. To do so, we use different definitions for determining the distance between two cells at positions $$(x_1, y_1)$$ and $$(x_2, y_2)$$ in the grid:
| name | formula |
|---|---|
| Euclidean distance | $$d=\sqrt{(x_1-x_2)^2 + (y_1-y_2)^2}$$ |
| Manhattan distance | $$d=|x_1-x_2| + |y_1-y_2|$$ |
| chessboard distance | $$d=\max(|x_1-x_2|,|y_1-y_2|)$$ |
The diagrams below show that the formula used to compute distances indeed has an influence on the shape of the regions in a Voronoi tessellation.


A distance function is a function that takes the positions of two points in the plane. The position of a point in the plane is a tuple $$(x, y)$$ with $$x, y \in \mathbb{R}$$ (float). A distance function always returns a real-valued number (float) that expresses the distance between the two given points according to some definition of distance. Your task:
-
Write three distance functions euclidean_distance, manhattan_distance and chessboard_distance that correspond to the concepts of distance carrying the same name (see table above).
-
Write a function herd that takes the location (str) of a text file containing a map with the positions of a herd of antelope. The function must return a tuple containing three elements. The first two elements are the number (int) of rows and columns of the rectangular grid in which the area where the herd is grazing has been divided. The third element is a dictionary (dict) that maps the position of each cell in the grid where an antelope is grazing onto the capital letter (str) used to mark the antelope on the map.
-
Write a function nearest_antelope that takes two arguments: i) the position of a cell in the grid and ii) a dictionary (dict) containing the positions of a herd of antelope. This dictionary must have the same form as the dictionaries returned by the function herd (as the third element of the tuple). The function must return a set containing the labels (str; capital letters) of the antelope in all cells that are closest to the given cell.
-
Write a function regions that takes the location (str) of a text file containing a map with the positions of a herd of antelope. The function must return a string (str) containing the grid from the text file, in which each cell that was marked by a dot has been replaced with a lowercase letter that corresponds to the label of the nearest antelope (cf. function nearest_antelope). The letter that comes first lexicographically must be used in case there are multiple antelope closest to that cell.
To determine the distance between two cells in the grid, the functions nearest_antelope and regions must use a distance function that can be passed to an optional parameter distance. The Euclidean distance must be used if no value has been explicitly passed to this parameter.
Example
In the following interactive session we assume the text file herd.txt4 to be located in the current directory.
>>> euclidean_distance((0, 0), (3, 4))
5.0
>>> manhattan_distance((0, 0), (3, 4))
7.0
>>> chessboard_distance((0, 0), (3, 4))
4.0

>>> herd('herd.txt5')
(9, 9, {(2, 3): 'A', (0, 6): 'B', (6, 1): 'C', (4, 7): 'D', (7, 5): 'E'})

>>> positions = {(2, 3): 'A', (0, 6): 'B', (6, 1): 'C', (4, 7): 'D', (7, 5): 'E'}
>>> nearest_antelope((0, 0), positions)
{'A'}
>>> nearest_antelope((3, 5), positions, distance=manhattan_distance)
{'A', 'D'}
>>> nearest_antelope((2, 5), positions, distance=chessboard_distance)
{'A', 'B', 'D'}

>>> print(regions('herd.txt6'))
aaaabbBbb
aaaaabbbb
aaaAaabdd
aaaaaaddd
ccaaaddDd
cccceeddd
cCcceeedd
ccceeEeee
ccceeeeee
>>> print(regions('herd.txt7', distance=manhattan_distance))
aaaabbBbb
aaaaabbbb
aaaAaabdd
aaaaaaddd
ccaaaddDd
cccaeeddd
cCcceeedd
ccceeEeee
ccceeeeee
>>> print(regions('herd.txt8', distance=chessboard_distance))
aaaaabBbb
aaaaabbbb
aaaAaabbb
aaaaaaddd
caaaaadDd
ccccedddd
cCcceeedd
cccceEeed
cccceeeee