This exercise demonstrates how to detect and handle outliers.
Ideally, this step is performed on data without missing values. However, in this exercise, we don’t do that to avoid dependencies on previous exercises.
First, create a new dataframe to avoid overwriting the existing dataframe.
train_X_outlier <- train_X
Detecting
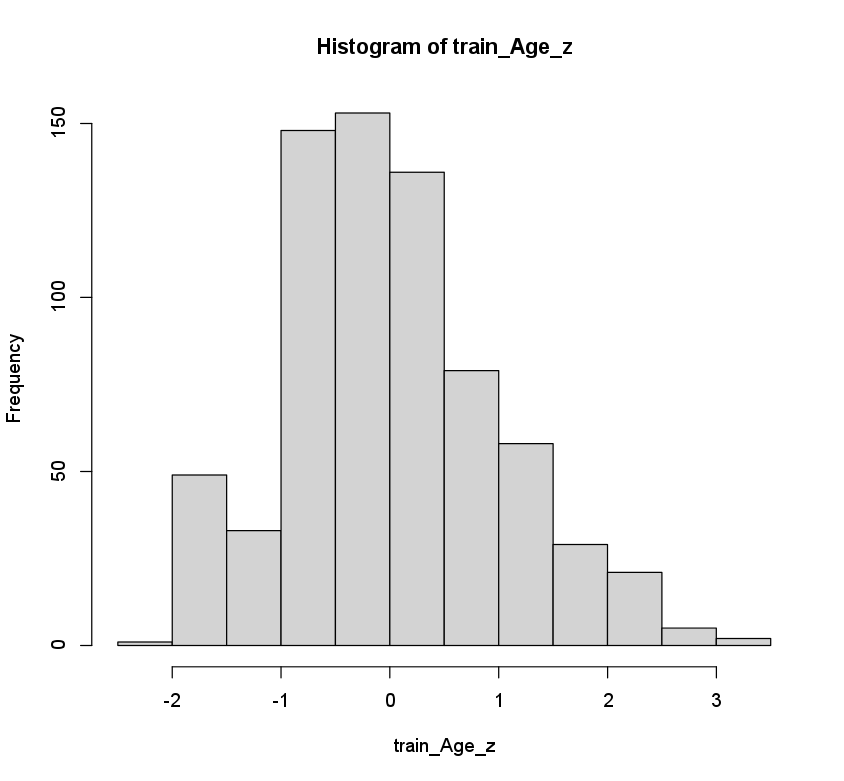
Outliers can be detected by computing the z-scores of the observations in a predictor. Observations with a z-score \(\vert z_i \rvert > 3\) are considered outliers.
Z-scores can be computed with the scale() function.
train_Age_z <- scale(train_X$Age)
hist(train_Age_z)
Handling
Valid outliers (e.g. CEO has salary of $5 million) can be handled by bringing their values back to the equivalent of \(\vert z_i \rvert = 3\).
Invalid outliers (e.g. age of 300 years) should be handled as missing values (see previous exercise).
handle_outlier_z <- function(col){
  col_z <- scale(col)
  ifelse(abs(col_z)>3,
         sign(col_z)*3*attr(col_z,"scaled:scale") + attr(col_z,"scaled:center"), col)
}
This function can be applied to 1 column or to multiple columns with sapply().
# 1 column
train_X_outlier$Age <- handle_outlier_z(train_X$Age)
# multiple columns
num.cols <- sapply(train_X, is.numeric)
train_X_outlier[, num.cols] <-  sapply(train_X[, num.cols], FUN = handle_outlier_z)
This step only changes the training data. We do not detect/handle outliers in the test data. That is, we would need information about other test observations to compute the z-score. This is not allowed because in practice, you don’t have 1 single batch of test observations.
Questions
- Start from the House Prices dataset you imported in exercise 1 and apply the same preprocessing steps (see boilerplate).
- Detect outliers in the
LotFrontagepredictor. Store the z-scores intrain_LotFrontage_z. Plot a histogram of the z-scores to check which ones exceed \(\vert z_i \rvert > 3\). - Copy the
train_Xdataframe intrain_X_outlier. - Handle the outliers in the
LotFrontagepredictor. Store the adjusted predictor values in the respective column oftrain_X_outlier. - Apply this procedure to multiple columns: handle the outliers for both
LotAreaandYearBuilt. Store the adjusted predictor values in the respective columns oftrain_X_outlier.
Assume that:
- The
train_X,train_y, andtest_Xdatasets have been loaded