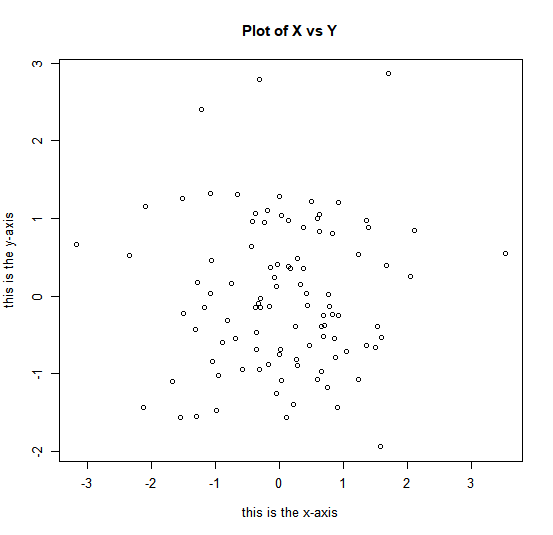
The plot() function is the primary way to plot data in R. For instance,
plot(x,y) produces a scatterplot of the numbers in x versus the numbers
in y. There are many additional options that can be passed into the plot()
function. For example, passing in the argument xlab will result in a label
on the x-axis. To find out more information about the plot() function,
type ?plot.
> x = rnorm(100)
> y = rnorm(100)
> plot(x, y)
> plot(x, y, xlab = "this is the x-axis", ylab = "this is the y-axis", main = "Plot of X vs Y")

The xlab and ylab parameters allows us to add text to the x and y-axis respectively.
The main parameter allows us to give our plot a title.
We will often want to save the output of an R plot. The command that we use to do this will depend on the file type that we would like to create. For instance, to create a pdf, we use the pdf() function, and to create a jpeg, we use the jpeg() function.
> pdf("Figure.pdf")
> plot(x, y, col = "green")
> dev.off()
null device
          1
The function dev.off() indicates to R that we are done creating the plot. Alternatively, we can simply copy the plot window and paste it into an appropriate file type, such as a Word document.