One of the most attractive properties of trees is that they can be
graphically displayed. We use the plot() function to display the tree structure,
and the text() function to display the node labels. The argument
pretty=0 instructs R to include the category names for any qualitative predictors,
rather than simply displaying a letter for each category.
plot(tree.carseats)
text(tree.carseats, pretty = 0)
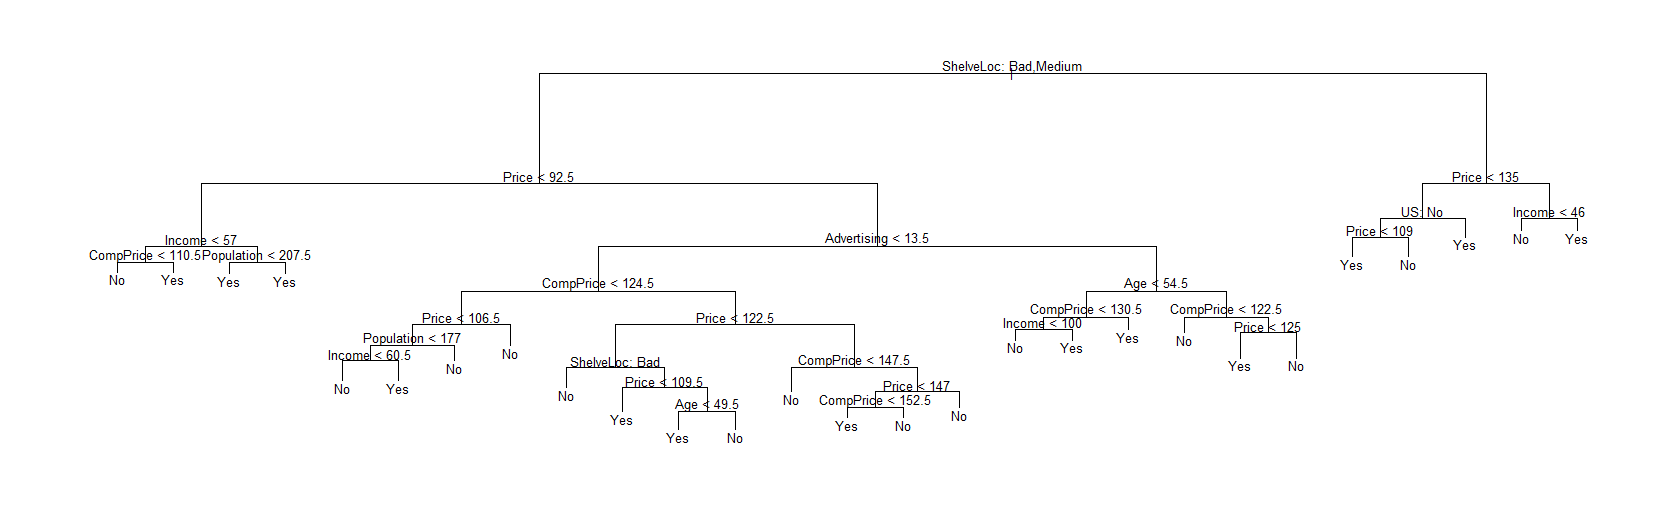 (Click on the image to see the full tree.)
The most important indicator of Sales appears to be shelving location,
since the first branch differentiates Good locations from Bad and Medium
locations.
tree.carseats

node), split, n, deviance, yval, (yprob)
      * denotes terminal node

  1) root 400 541.500 No ( 0.59000 0.41000 )
    2) ShelveLoc: Bad,Medium 315 390.600 No ( 0.68889 0.31111 )
      4) Price < 92.5 46  56.530 Yes ( 0.30435 0.69565 )
        8) Income < 57 10  12.220 No ( 0.70000 0.30000 )
  ...
If we just type the name of the tree object, R prints output corresponding
to each branch of the tree. R displays the split criterion (e.g. Price<92.5), the
number of observations in that branch, the deviance, the overall prediction
for the branch (Yes or No), and the fraction of observations in that branch
that take on values of Yes and No. Branches that lead to terminal nodes are
indicated using asterisks.
Questions
- Again, fit a classification tree on the OJ dataset with
Purchaseas dependent variable and all other variables as independent variables. Store the model in the variabletree.oj. - MC1: Inspect the tree plot. What is the most important indicator of
Purchase?- 1:
PriceDiff - 2:
ListPriceDiff - 3:
LoyalCH - 4:
PriceCH
- 1:
- MC2: Inspect the
tree.ojobject. When building the tree, how many of the training observations were classified following the pathLoyalCH < 0.5036,LoyalCH > 0.276142, andPriceDiff < 0.05.
(hint: look at the variablenin the output)- 1:
n= 75 - 2:
n= 40 - 3:
n= 145 - 4:
n= 101
- 1:
Assume that:
- The ISLR2 and tree library have been loaded
- The OJ dataset has been loaded and attached