The emission spectrum of a chemical element or a chemical compound is the spectrum of frequencies of electromagnetic radiation emitted due to an atom or molecule making a transition from a high energy state to a lower energy state. The energy of the emitted photon is equal to the energy difference between the two states.
There are many possible electron transitions for each atom, and each transition has a specific energy difference. This collection of different transitions — leading to different radiated wavelengths — make up an emission spectrum.
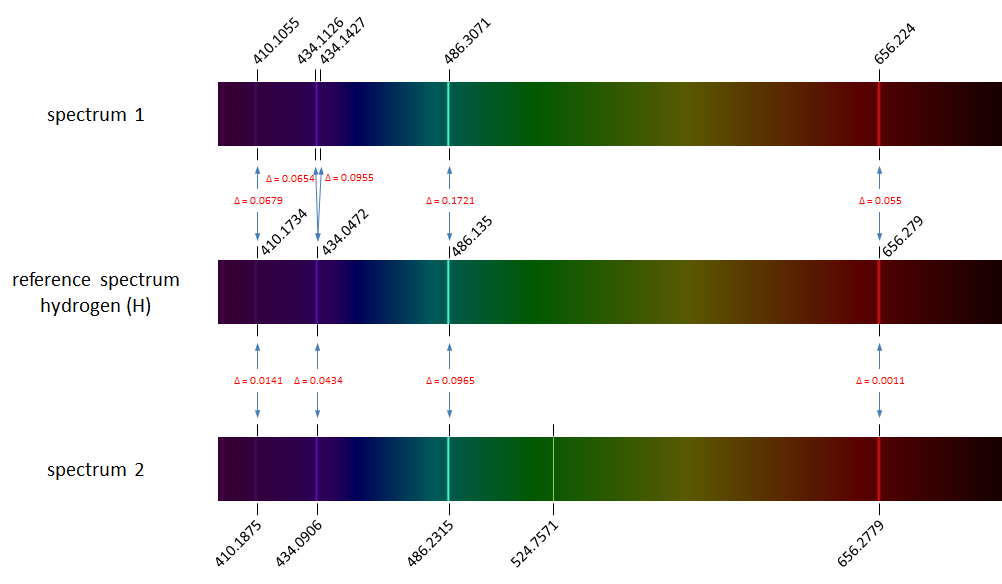
Each element's emission spectrum is unique. As an example, the image below shows the visible hydrogen emission spectrum that contains four main spectral lines.

As a result, spectroscopy can be used to identify the elements in matter of unknown composition. Similarly, the emission spectra of molecules can be used in chemical analysis of substances.
This requires taking into account a number of different forms of variation that may occur when determining emission spectra. Because of measurement errors, measured wavelengths of spectral lines usually slightly deviate from the corresponding spectral lines in an emission spectrum used as a reference. In addition, it is not necessarily the case that all possible electron transitions take place in the substance under investigation, so that the corresponding spectral lines are not measured. Due to interference between the different atoms in a substance, additional spectral lines might also appear that do not occur in the reference spectra of the individual atoms.

The figure above shows the reference spectrum of hydrogen (middle) containing four spectral lines. The spectra on top and below the reference spectrum are emission spectra of hydrogen as measured in the lab. We observe slight deviations in the measured wavelengths of the spectral lines (wavelengths are indicated above or below the spectra). All corresponding spectral lines between the reference spectrum and the measured spectra are indicates by blue arrows, which also contain the absolute value of the deviation ($$\Delta$$). The spectrum on top shows a duplication of the second spectral line from the reference spectrum caused by a measurement error. The spectrum at the bottom shows a spurious spectral line popping up at wavelength 524.8 nm.
Assignment
We represent the emission spectrum of an atom or a chemical substance as a tuple of numbers (float). These numbers represent wavelengths of spectral lines in the emission spectrum, and are always sorted in increasing order.
If we store the reference spectra of a series of atoms in a text file, we use a format that has the symbolic name of each atom on a separate line, followed by a tab and the wavelengths of the spectral lines in the emission spectrum of that atom. The wavelengths of the spectral lines are separated from each other using commas (,). In this storage format, the wavelengths are not necessarily in increasing order. The following example shows the content of the file spectra.txt1.
H	486.135,434.0472,656.279,410.1734
He	501.56783,667.8151,587.5621,471.31457,492.19313,504.7738,447.14802,438.79296,402.61914,412.08154
Li	610.354,670.791,413.259,610.365,670.776
Hg	404.6565,407.7837,434.74945,435.8335,535.4034,546.075,567.581,576.961,579.067,580.3782,585.9254,671.634,690.746
Your task:
-
Write a function reference_spectra that takes the location (str) of a text file containing the reference spectra of a series of atoms. The function must return a dictionary (dict) that maps the symbolic name (str) of each atom in the file onto its reference spectrum (represented as an emission spectrum).
-
Write a function reference_lines that takes two emission spectra: i) a measured spectrum and ii) a reference spectrum. The function also has a third optional parameter eps that takes a value $$\epsilon$$ (float; default value 0.1). The value $$\epsilon$$ represents the maximal deviation allowed between corresponding spectral lines in the two given spectra. The function must return the number (int) of spectral lines in the reference spectrum that have at least one corresponding spectral line in the measured spectrum. A spectral line having wavelength $$g_r$$ in the reference spectrum corresponds to a spectral line having wavelength $$g_m$$ in the measured spectrum if $$|g_r - g_m| \leq \epsilon$$.
-
Write a function decomposition that takes two arguments: i) a measured spectrum and ii) a dictionary (dict) of reference spectra that is formatted as the dictionaries returned by the function reference_spectra. The function also has an optional parameter eps that has the same meaning and default value as for the function reference_lines. The function also has an optional parameter minimum that may take a positive integer (int). The function must return an alphabetically sorted list (list) of the symbolic names (str) of all atoms that occur in the given dictionary, whose corresponding reference spectrum has a "sufficient" number of corresponding spectral lines in the measured spectrum. The function reference_lines must be used to determine the number of corresponding spectral lines between the measured spectrum and a reference spectrum, as well as the value passed to the parameter eps. If a value was explicitly passed to the parameter minimum, this value indicates the minimum number of corresponding spectral lines that is considered to be "sufficient". If no explicit value was passed to the parameter minimum, the number of corresponding spectral lines is only "sufficient" if all spectral lines in the reference spectrum have a corresponding spectral line in the measured spectrum.
Example
In the following interactive session, we assume that the text file spectra.txt2 is located in the current directory.
>>> reference_spectrum = reference_spectra('spectra.txt3')

>>> reference_spectrum['H']
(410.1734, 434.0472, 486.135, 656.279)
>>> reference_spectrum['Li']
(413.259, 610.354, 610.365, 670.776, 670.791)

>>> spectrum1 = (410.1055, 434.1126, 434.1427, 486.3071, 656.224)
>>> reference_lines(spectrum1, reference_spectrum['H'])
3
>>> spectrum2 = (410.1875, 434.0906, 486.2315, 524.7571, 656.2779)
>>> reference_lines(spectrum2, reference_spectrum['H'], eps=0.1)
4
>>> reference_lines(spectrum2, reference_spectrum['H'], eps=0.025)
2

>>> spectrum = (402.5579, 410.1914, 413.162, 434.1243, 486.0598, 504.7387, 610.157, 610.562, 656.354, 670.578, 670.991)
>>> decomposition(spectrum, reference_spectrum)
['H']
>>> decomposition(spectrum, reference_spectrum, eps=0.2)
['H', 'Li']
>>> decomposition(spectrum, reference_spectrum, minimum=2)
['H', 'He']
>>> decomposition(spectrum, reference_spectrum, eps=0.2, minimum=2)
['H', 'He', 'Li']