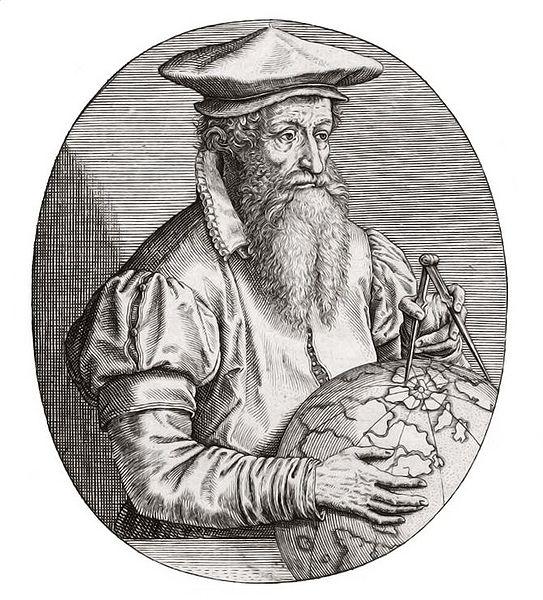
The Mercator map must be one of the most famous map projections in the history of shipping. It was named after the Flemish cartographer Gerardus Mercator, who introduced this projection in 1569. Norman Thrower wrote about this Mercator map: 'Just like other projections, the Mercator is conformal (the angles are represented correctly), but it also has a unique property: straight lines are loxodromes (lines with a constant compass point)'. This last property was of great value to the ship navigators that needed to determine their course using compasses and other means to direct their ship in the right geographical direction. The English mathematician Edward Wright also analyzed the fascinating properties of the map in his Certain Errors in Navigation from 1599. At the beginning of the 18th century, the use of the Mercator map increased after the invention of the ship chronometer, a new sort of watch with which the longitude could be determined.

The Mercator projection or normal conform projection converts a longitude $$\lambda$$ ($$-180^{\circ} < \lambda \leq 180^{\circ}$$) and a latitude $$\varphi$$ ($$-90^{\circ} \leq \varphi \leq 90^{\circ}$$) of a location expressed in spherical co-ordinates in cartesian co-ordinates $$(x,y)$$ in a flat area. The projection is characterized by the following comparisons: \[ \begin{array}{rcl} x &=& R(\lambda - \lambda_0) \\ y &=& \frac{R}{2} \ln\left(\frac{1 + \sin\varphi}{1 - \sin\varphi}\right) \end{array} \] Here, $$\lambda$$ and $$\varphi$$ are expressed in radians, and $$\lambda_0$$ indicates the longitude that is projected onto the centre of the map. The value $$R$$ represents the radius of the earth (6378,1 kilometres). Based on these formulas, one can easily deduct an important flaw of the Mercator projection: areas that are far from the equator, are enlarged. Because of this deformation, Greenland looks like it has the same size as Africa, while Africa is actually fourteen times bigger.
Assignment
Write a function mercatorprojection, to which three real numbers are given as an argument: the longitude $$\lambda_0$$ that is portrayed in the centre of the map, and the longitude $$\lambda$$ and latitude $$\varphi$$ of a point on earth in spherical co-ordinates. These three co-ordinates are expressed in decimal notation. The function has to print a tuple $$(x, y)$$ as a result that indicates the location in cartesian co-ordinates x and y. For the earth's radius you may use 6378.1 kilometers, and also the values $$x$$ and $$y$$ must be expressed in kilometers. Look at section 6.7 of the text book to see how to make sure a function prints a tuple as a result.
Example
>>> mercatorprojection(25.0, 125.50, 40.0)
(11187.54392465576, 4865.914051846049)
>>> mercatorprojection(0.0, 0.0, 0.0)
(0.0, 0.0)
>>> mercatorprojection(-120.0, 22.55, -13.70)
(15868.501357807745, -1539.8116898053572)
>>> mercatorprojection(-5.78, 22.0, 88.80)
(3092.43751469589, 29077.860165059174)
>>> mercatorprojection(-5.78, -55.78, 88.80)
(-5565.942251072516, 29077.860165059174)