Here we briefly describe some of the functions that are available in a basic R installation.
plot
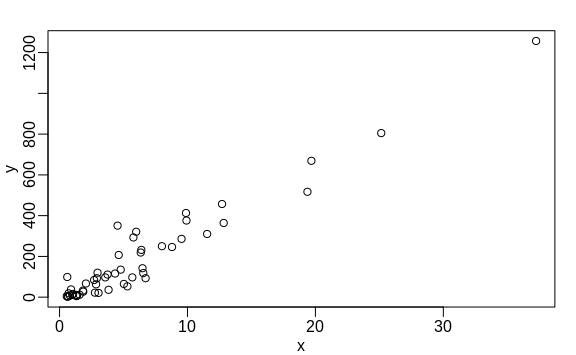
The plot function can be used to make scatterplots.
Here is a plot of total murders versus population.
x <- murders$population / 10^6
y <- murders$total
plot(x, y)

hist
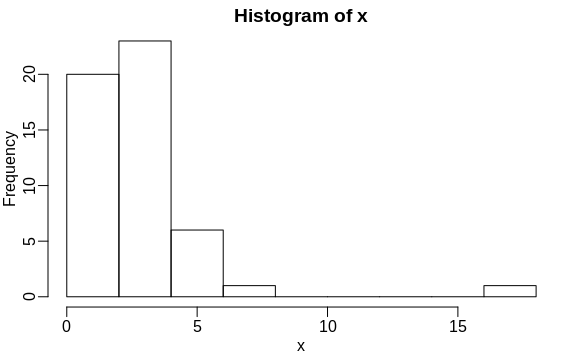
Histograms are a powerful graphical summary of a list of numbers that gives you a general overview of the types of values you have. We can make a histogram of our murder rates by simply typing:
x <- with(murders, total / population * 100000)
hist(x)

We can see that there is a wide range of values with most of them between 2 and 3 and one very extreme case with a murder rate of more than 15:
murders$state[which.max(x)]
#> [1] "District of Columbia"
boxplot
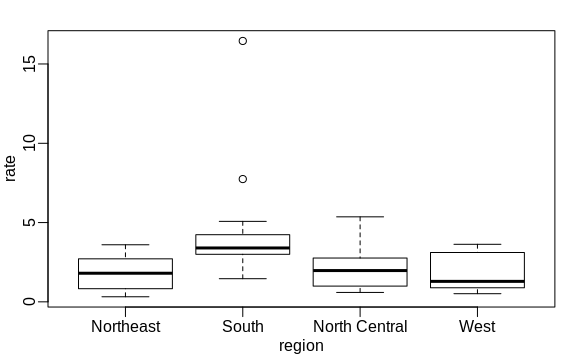
Boxplots provide a more concise summary than histograms, but they are easier to stack with other boxplots. For example, here we can use them to compare the different regions:
murders$rate <- with(murders, total / population * 100000)
boxplot(rate~region, data = murders)

We can see that the South has higher murder rates than the other three regions.