A dot plot is one of the oldest graphical representations to compare two biological sequences. Areas of two sequences that look alike a lot are visualized in a dot plot as diagonals.

Dot plots are built as two-dimensional matrices of which the rows correspond with the consecutive windows (this is the term that is used in this context for connected areas within a sequence) of the first sequence, and the columns with the consecutive windows from the second sequence. In the most simple shape, the windows are formed by the individual residues (letters) of a sequence, but in expansion, a window can also consist of $$n$$ consecutive residues. One cell of the matrix is made black (represented as the Boolean value True) if the corresponding window of the first sequence shows enough resemblance with the corresponding window from the second sequence. Otherwise, the cell from the matrix stays white (represented by the Boolean value False).
Assignment
Define a class Dotplot which can be used to make dot plots for two given biological sequences. Biological sequences are hereby represented as strings that only consist of letters from the alphabet (that represent the individual residues). Positions within these sequences are indexed from zero. Objects from the Dotplot must have the following methods:
An initializing method to which two biological sequences as argument must be given as an argument. These sequences must be kept as attributes of the newly made object of the class Dotplot.
A method windows with three parameters: i) a parameter start1 $$\in \mathbb{N}$$ that indicates a start position within the first sequence, ii) a parameter start2 $$\in \mathbb{N}$$ that indicates a start position within the second sequence, and iii) an optional parameter length $$\in \mathbb{N}_0$$ that indicates the length of a window (standard value 1). The method must print a tuple of two partial sequences that start at the respective start positions of the two sequence-attributes of the object, and have the given length as indicated by the parameter length. Deduce how the method must react if an invalid window size is given (a strictly positive number) from the example session, or if any windows from the given start positions can be cut from the given length.
A method equal with four parameters: The same three parameters that are used by the method windows, and an optional parameter number $$\in \mathbb{N}_0$$ (standard value 1). The method must print a Boolean value as a result, that indicates if the number of equal similar residues (letters) of the windows that correspond with the first three parameters are larger than or equal to the value that was given to the parameter number. When comparing the residues, you may not make a distinction between uppercase and lowercase letters.
A method plot that prints a two-dimensional matrix of a Boolean value. This matrix is represented as a list of lists, where the inner lists represents the rows of the matrix. The rows correspond with the consecutive windows from the first sequence attribute, and the columns correspond with the consecutive windows of the second sequence attribute. Windows have a set length (optional parameter length $$\in \mathbb{N}_0$$; standard value 1) and consecutive windows are a set number of positions away from each other (optional parameter step $$\in \mathbb{N}_0$$; the length of the windows is taken as the standard value). With these parameters, both overlapping and non-overlapping windows can be defined. A cell from the matrix gets the Boolean value True if the corresponding window from the first sequence shows enough similarity ( as defined by the method equal, combined with the optional parameter number $$\in \mathbb{N}_0$$; standard value 1) with the corresponding window from the second sequence. Otherwise, it gets the Boolean value False.
Example
Click the links in the example session below to see a graphical display of the dot plots.
>>> dotplot = Dotplot('ATCCTC', 'ATTCTCG')
>>> dotplot.windows(start1=1, start2=4, length=3)
('TCC', 'TCG')
>>> dotplot.windows(start1=1, start2=4, length=-3)
Traceback (most recent call last):
AssertionError: invalid window size
>>> dotplot.windows(start1=1, start2=5, length=3)
Traceback (most recent call last):
AssertionError: invalid start position
>>> dotplot.equal(start1=1, start2=4, length=3)
True
>>> dotplot.equal(start1=1, start2=4, length=3, number=2)
True
>>> dotplot.equal(start1=1, start2=4, length=3, number=3)
False
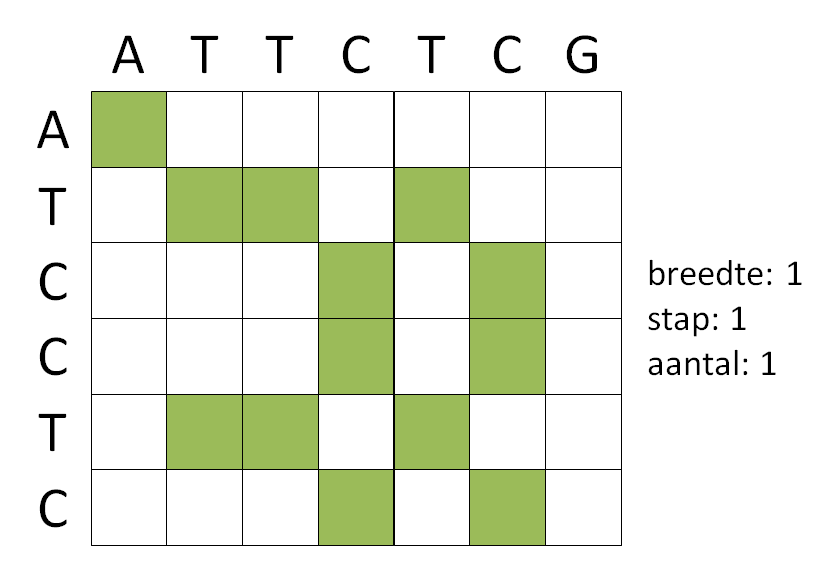
>>> dotplot.plot(length=1, step=1, number=1)
[[True, False, False, False, False, False, False], [False, True, True, False, True, False, False], [False, False, False, True, False, True, False], [False, False, False, True, False, True, False], [False, True, True, False, True, False, False], [False, False, False, True, False, True, False]]
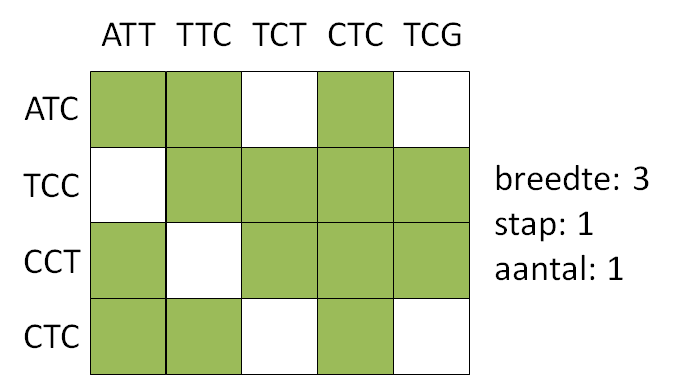
>>> dotplot.plot(length=3, step=1, number=1)
[[True, True, False, True, False], [False, True, True, True, True], [True, False, True, True, True], [True, True, False, True, False]]
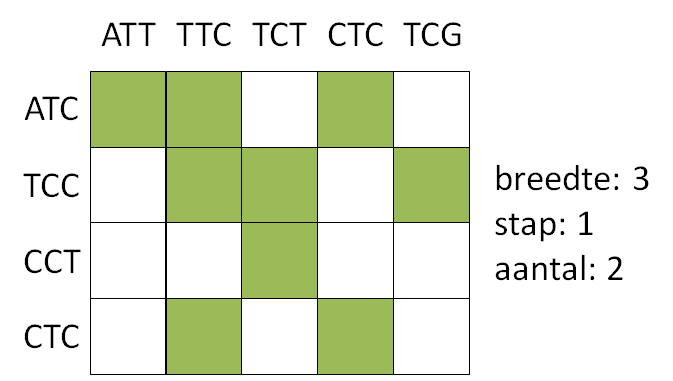
>>> dotplot.plot(length=3, step=1, number=2)
[[True, True, False, True, False], [False, True, True, False, True], [False, False, True, False, False], [False, True, False, True, False]]
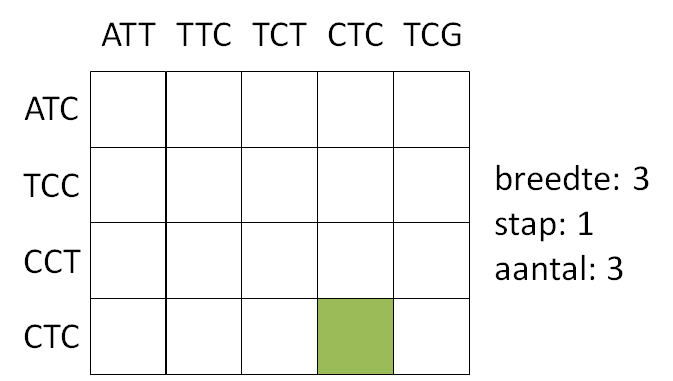
>>> dotplot.plot(length=3, step=1, number=3)
[[False, False, False, False, False], [False, False, False, False, False], [False, False, False, False, False], [False, False, False, True, False]]
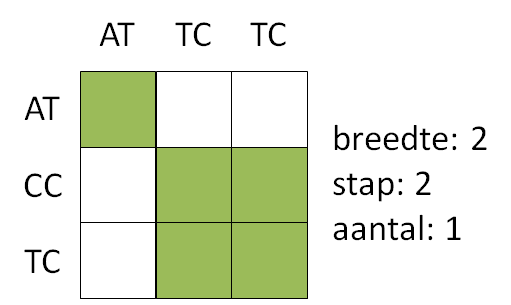
>>> dotplot.plot(length=2)
[[True, False, False], [False, True, True], [False, True, True]]
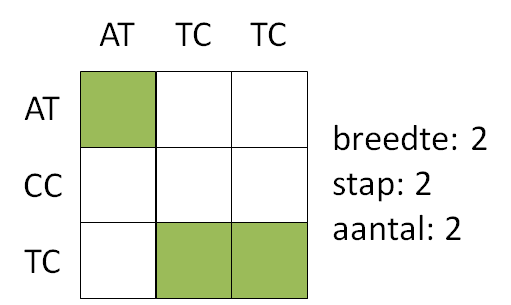
>>> dotplot.plot(length=2, number=2)
[[True, False, False], [False, False, False], [False, True, True]]
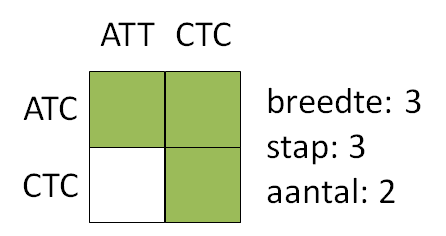
>>> dotplot.plot(length=3, number=2)
[[True, True], [False, True]]