Network Visualisation with statnet and igraph
In this exercise, we will learn how to visualize networks using the statnet and igraph packages in R. Visualizing networks can help us better understand their structure and characteristics.
Visualising Networks with statnet
The plot.network() function from the statnet package can be used to visualize networks.
The mode parameter determines the layout algorithm used for the plot.
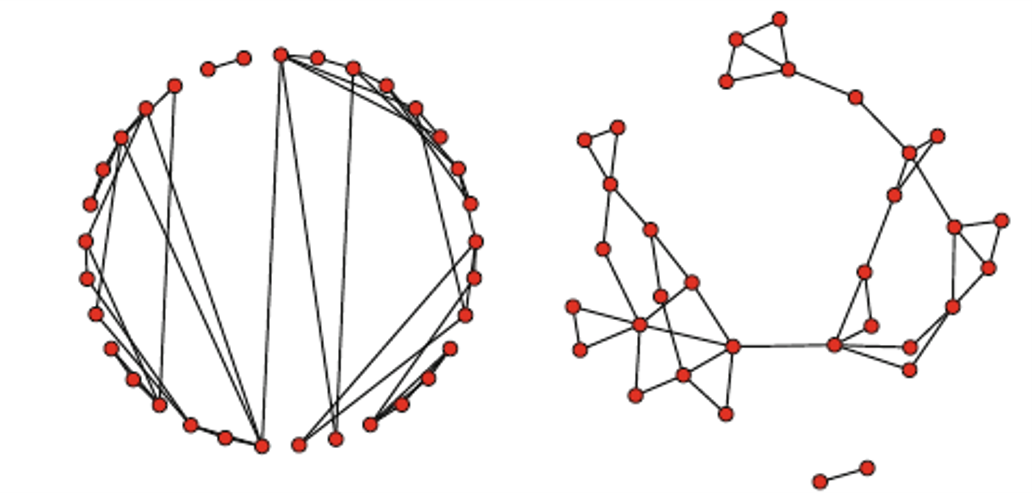
Here’s an example of how to plot a network using two different layout algorithms:
op <- par(mar = rep(0,4), mfrow = c(1,2))
plot(Moreno, mode = "circle", vertex.cex = 1.5)
plot(Moreno, mode = "fruchtermanreingold", vertex.cex = 1.5)
par(op)
The gplot() function from the statnet package provides more options for visualizing networks:
par(mfrow = c(1,1))
gplot(Moreno, gmode = "graph", mode = "fruchtermanreingold", vertex.cex = 1.5, main = "Fruchterman-Reingold")
The mode tells R which plotting algorithm to use. The gmode option is used to tell R not to plot a directed graph.
To see all the options, use the function ?gplot.
Visualising Networks with igraph
The igraph package also provides functions for visualizing networks. You can learn more about these functions by using the ?igraph.plotting command or by reading the book A user’s guide to network analysis in R.
Customising Network Visualisations
You can customise your network visualisations by changing the node colors, labels, and sizes. Here’s an example of how to do this:
adjacency_matrix <- rbind(
c(0,1,1,0,0),
c(0,0,1,1,0),
c(0,1,0,0,0),
c(0,0,0,0,0),
c(0,0,1,0,0)
)
net <- network(adjacency_matrix, matrix.type="adjacency")
network::set.vertex.attribute(net, "gender", c("F", "F","M", "F", "M"))
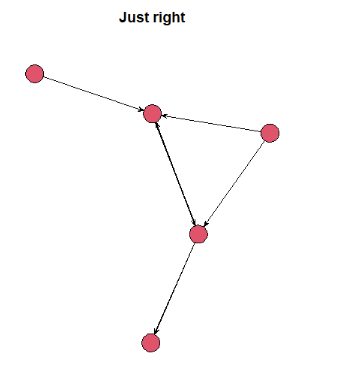
plot(net, vertex.cex = 3, main = "Just right")
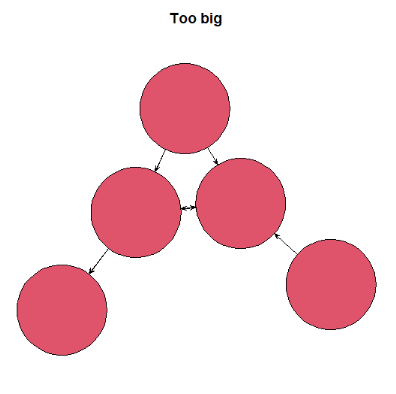
plot(net, vertex.cex = 15, main = "Too big")
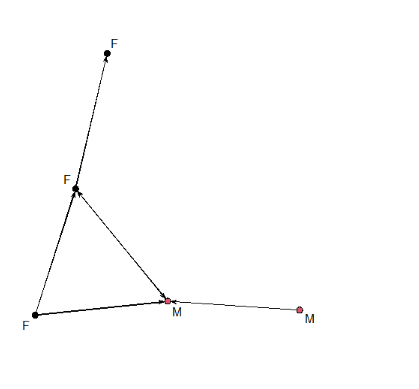
gender_color <- get.vertex.attributes(net, "gender")
plot(net, vertex.col = "gender", label = gender_color)
The code block above gives males and females different colors as well as labels.