Drop links or images here to add them to the editor.
This problem makes use of the following table.
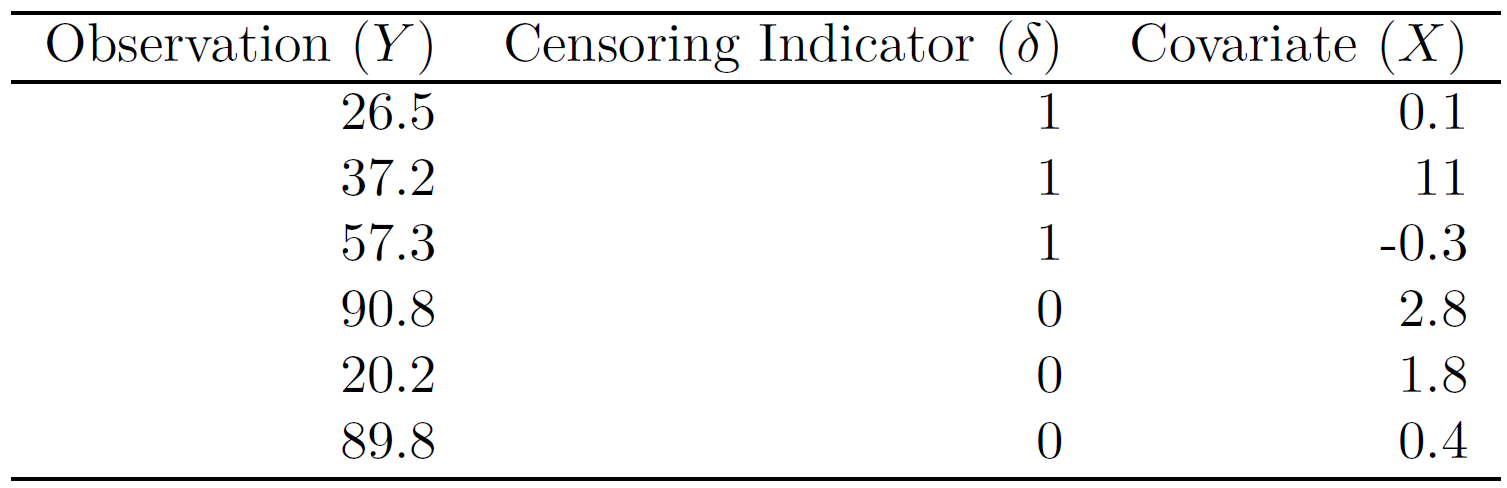
You can create the table in R as follows:
df <- data.frame(observation = rep(c(26.5, 37.2, 57.3, 90.8, 20.2, 89.8)),
                 censoring = rep(c(1, 1, 1, 0, 0, 0)),
                 covariate = rep(c(0.1, 11, -0.3, 2.8, 1.8, 0.4)), stringsAsFactors = T)
Questions
- Create two groups of observations. In Group 1, \(X < 2\), whereas
in Group 2, \(X \geq 2\). Use the
ifelse()andas.factor()functions to add a new column to the dataframe, namedgroup, containing factor levels"Group 1"and"Group 2".
Plot the Kaplan-Meier survival curves corresponding to the two groups. Store the model in the variablefit.km. Be sure to label the curves so that it is clear which curve corresponds to which group. By eye, does there appear to be a difference between the two groups’ survival curves? Answer the question below.
- MC1 : Which group do you expect to have a significantly higher risk than the
other group?
- 1: Group 1
- 2: Group 2
- 3: There is no significant difference visible between both groups
- MC1 : Which group do you expect to have a significantly higher risk than the
other group?
- Fit Cox’s proportional hazards model, using the
groupindicator as a covariate, store the model in the variablefit.cox. Inspect the output of the model and answer the following question.
- MC2 :
A) The risk associated with group 2 is 0.34 times the risk associated with group 1
B) There is no evidence the true coefficient value is non-zero- 1: Both statements are true
- 2: Both statements are false
- 3: A is true, B is false
- 4: A is false, B is true
- MC2 :
- Recall that in the case of a single binary
covariate, the log-rank test statistic should be identical to the
score statistic for the Cox model. Conduct a log-rank test to determine
whether there is a difference between the survival curves
for the two groups. Store the result in the variable
logrank.test. Verify that the log-rank test statistic equals the score statistic for the Cox model and answer the following question.
- MC3 : How does the p-value for the log-rank test
statistic compare to the p-value for the score statistic for the
Cox model from question 2? (ignore any roundings)
- 1: They are equal
- 2: The p-value for log-rank is higher
- 3: The p-value for log-rank is lower
- MC3 : How does the p-value for the log-rank test
statistic compare to the p-value for the score statistic for the
Cox model from question 2? (ignore any roundings)
NOTE: the outputs of
logrank.testandsummary(fit.cox)return rounded \(p\)-values. In order to compare the exact \(p\)-values, inspect the appropriate attributes of the objects.
Assume that:
- The
ISLR2library has been loaded. - The
survivallibrary has been loaded.