Even for the most seasoned programmers, it is impossible to write error-free source code right away. Therefore, development environments like PyCharm provide quite some support for debugging source code.
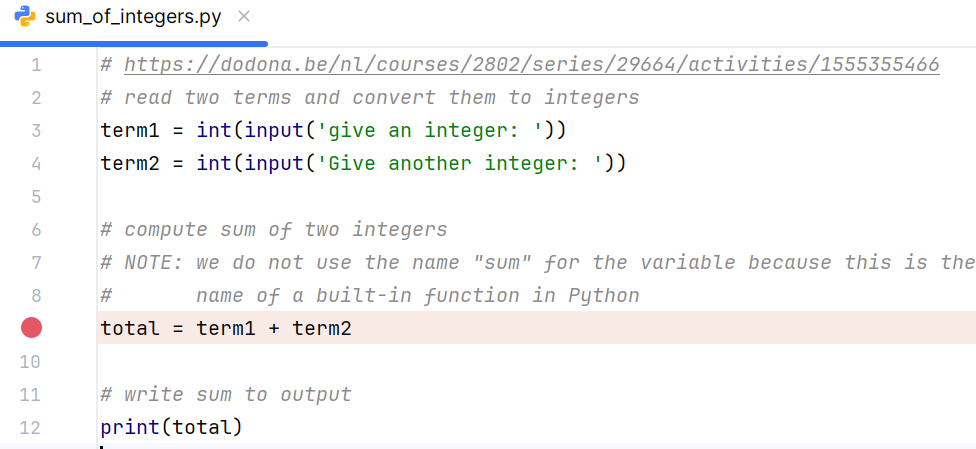
To start debugging, it suffices to first add one or more breakpoints to your source code. This can be done by clicking in the left margin of the Editor window (where you enter your source code).
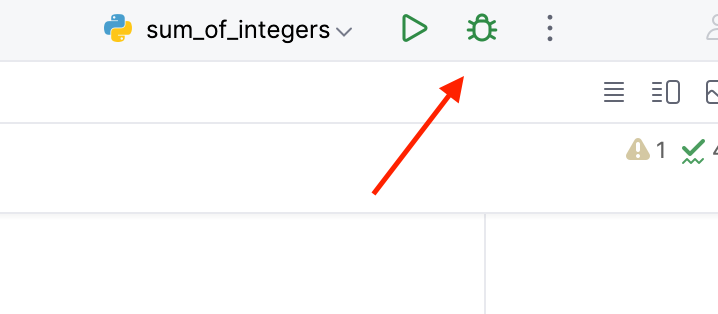
If you then right click in the Editor window and select the option Debug ‘name of your program’ from the popup menu, a new debug session is started. As an alternative, you can select Run ➤ Debug (or Shift-F9) from the main menu or you can click the button shown below.
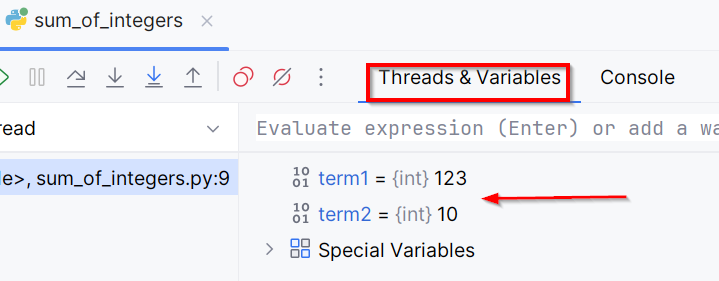
Your program is now executed until the debugger hits the first breakpoint. This automatically brings you to the Debugger window, where you can inspect the current values of all variables in the Threads & Variables tab.
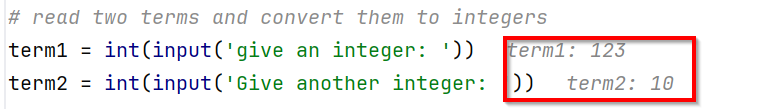
Note that the values of the variables are now also displayed in the Editor window.
Using the buttons shown at the top of the Debugger window (or the shortcuts F8, F7, Alt-Shift-F7 and Shift-F8) you can step through your code.
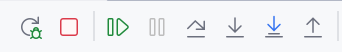
In the table below we provide an overview of all the debug operations that can be performed using the buttons or shortcuts.
| Button | Shortcut | Description |
|---|---|---|
| F7 | Step Into - jumps to the statement that will be executed next in the source code; if the next statement is a method or a function, this shortcut will enter the source code associated with the method or function | |
| F8 | Step Over - jumps over function or method calls; function or method call will be executed, but the debugger will never halt in the source code associated with the function or method | |
| Shift + Alt + F7 | Step Into My Code - jumps to the statement that will be executed next in the source code; in case the next statement calls a method or a function, this short key will only enter the source code associated with the method or function if this is your own code; library resources will be skipped | |
| Shift + F8 | Step Out - jumps back to the statement that called the current function or method; this will leave the current code block and return to the calling statement | |
| F9 | Resume Program - proceed until the next breakpoint is reached; if no more breakpoints are reached, the source code will be executed until the end (or until an uncaught exception is raised while executing the source code) |