Although the CDF concept is widely discussed in statistics textbooks, the plot is actually not very popular in practice. The main reason is that it does not easily convey characteristics of interest such as: at what value is the distribution centered? Is the distribution symmetric? What ranges contain 95% of the values? Histograms are much preferred because they greatly facilitate answering such questions. Histograms sacrifice just a bit of information to produce plots that are much easier to interpret.
The simplest way to make a histogram is to divide the span of our data into non-overlapping bins of the same size. Then, for each bin, we count the number of values that fall in that interval. The histogram plots these counts as bars with the base of the bar defined by the intervals. Here is the histogram for the height data splitting the range of values into one inch intervals: \((49.5, 50.5],(50.5, 51.5],(51.5,52.5],(52.5,53.5],...,(82.5,83.5]\)
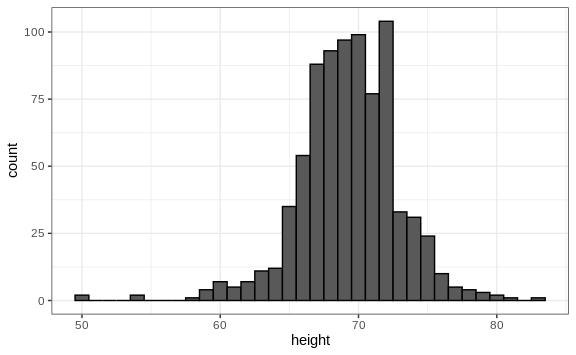
As you can see in the figure above, a histogram is similar to a barplot, but it differs in that the x-axis is numerical, not categorical.
If we send this plot to ET, he will immediately learn some important properties about our data. First, the range of the data is from 50 to 84 with the majority (more than 95%) between 63 and 75 inches. Second, the heights are close to symmetric around 69 inches. Also, by adding up counts, ET could obtain a very good approximation of the proportion of the data in any interval. Therefore, the histogram above is not only easy to interpret, but also provides almost all the information contained in the raw list of 812 heights with about 30 bin counts.
What information do we lose? Note that all values in each interval are treated the same when computing bin heights. So, for example, the histogram does not distinguish between 64, 64.1, and 64.2 inches. Given that these differences are almost unnoticeable to the eye, the practical implications are negligible and we were able to summarize the data to just 23 numbers.
We discuss how to code histograms in Section 8.16.