Starting from the Adjacency Matrix
In this exercise, we will learn how to create a network object from an adjacency matrix using the statnet package in R. This is a fundamental step in network analysis as it allows us to convert raw data into a format that can be used for further analysis.
Generating Data
First, we need to generate some data in matrix format. This matrix will represent our network, where each row and column corresponds to a node, and the value at the intersection of a row and column indicates whether an edge exists between those nodes.
Here’s an example of how to generate such a matrix:
adjacency_matrix <- rbind(
  c(0,1,1,0,0),
  c(0,0,1,1,0),
  c(0,1,0,0,0),
  c(0,0,0,0,0),
  c(0,0,1,0,0)
)
Naming Rows and Columns
Next, we provide names for the rows and columns. These names correspond to the nodes in our network:
rownames(adjacency_matrix) <- c("A", "B", "C", "D", "E")
colnames(adjacency_matrix) <- c("A", "B", "C", "D", "E")
Creating a Network Object
Now that we have our matrix, we can create a network object from it using the network() function.
Since we’re using an adjacency matrix as input, we specify this with the matrix.type parameter:
adjacency_network <- network(adjacency_matrix, matrix.type="adjacency")
Checking the Network Object
To confirm that our network object was created successfully, we can check its class type with the class() function:
class(adjacency_network)
[1] "network"
We can also use the summary() function to get more information about the network, such as the number of vertices:
summary(adjacency_network)
Network attributes:
  vertices = 5
  directed = TRUE
  hyper = FALSE
  loops = FALSE
  multiple = FALSE
  bipartite = FALSE
 total edges = 6
   missing edges = 0
   non-missing edges = 6
 density = 0.3

Vertex attributes:
  vertex.names:
   character valued attribute
   5 valid vertex names

No edge attributes

Network adjacency matrix:
  A B C D E
A 0 1 1 0 0
B 0 0 1 1 0
C 0 1 0 0 0
D 0 0 0 0 0
E 0 0 1 0 0
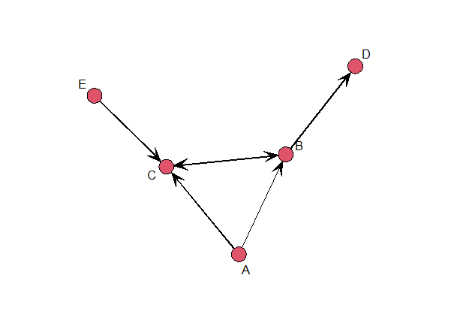
Visualizing the Network
Finally, we can visualize our network using the gplot() function:
gplot(adjacency_network, vertex.col = 2, displaylaels = TRUE)
Exercise
The adjacency matrix below defines whether Adam, Bob, Carol, Diesel and Erika are friends.
Give the adjacency matrix appropriate row and column names and
create a network object called friends_network.
Assume that:
- The network library has been loaded.