The function kmeans() performs K-means clustering in R. We begin with
a simple simulated example in which there truly are two clusters in the
data: the first 25 observations have a mean shift relative to the next 25
observations.
set.seed(2)
x <- matrix(rnorm(50 * 2), ncol = 2)
x[1:25, 1] = x[1:25, 1] + 3
x[1:25, 2] = x[1:25, 2] - 4
We now perform K-means clustering with \(K = 2\).
km.out <- kmeans(x, 2, nstart = 20)
The cluster assignments of the 50 observations are contained in km.out$cluster.
> km.out$cluster
 [1] 1 1 1 1 1 1 1 1 1 1 1 1 1 1 1 1 1 1 1
[20] 1 1 1 1 1 1 2 2 2 2 2 2 2 2 2 2 2 2 2
[39] 2 2 2 2 2 2 2 2 2 2 2 2
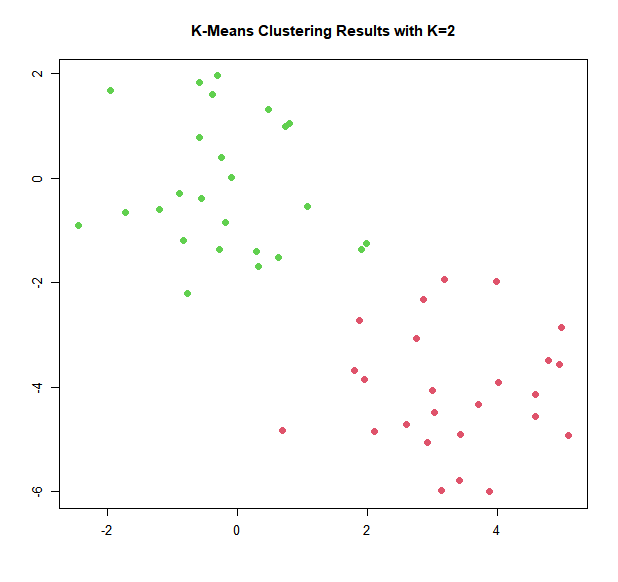
The K-means clustering perfectly separated the observations into two clusters
even though we did not supply any group information to kmeans(). We
can plot the data, with each observation colored according to its cluster
assignment.
plot(x, col = (km.out$cluster + 1), main = "K-Means Clustering Results with K=2",
     xlab = "", ylab = "", pch = 20, cex = 2)

Here the observations can be easily plotted because they are two-dimensional. If there were more than two variables then we could instead perform PCA and plot the first two principal components score vectors.
If we would add less distinction between the two clusters, the K-means algorithm would have more issues in successfully clustering both groups.
For the altered example below, try performing a K-means clustering with \(K = 2\) and let the algorithm run for a maximum of 100 iterations (use the correct argument).
Store the result in km.out.
Look at the new plot to examine the results.