In this exercise, you will further analyze the Wage data set considered throughout this chapter, available in the ISLR2 package.
Questions
Some of the exercises are not tested by Dodona (for example the plots), but it is still useful to try them.
- Perform polynomial regression to predict
wageusingageand use 10-fold cross-validation to select the optimal degree \(d\) for the polynomial.- Set a seed value of 4.
- Initialize an empty vector to store the CV errors. Store it in
deltas. - In each iteration
iof the for loop, fit a linear model with a polynomial of orderi. Check degree 1 to 10. - With the
cv.glm()function, store the CV error in thei-th element of the vectordeltas.poly. Set the correct value for \(K\) and use the attributedelta[1]to extract the CV error. - Inspect the vector
deltasand make a line plot. - Which order polynomial \(d\) has the lowest test MSE? Store the answer in
d.min.poly.
Verify your decision by comparing it to the results of hypothesis testing using ANOVA.
- Fit 5 models with increasing order of polynomials.
fit1has order-1 untilfit5with order-5. -
Perform an ANOVA analysis using the 5 model. Store it in
anova.poly.- MC1:
Interpret the output. What can you conclude based on ANOVA?- 1: A model of order-1 or order-2 is most appropriate
- 2: A model of order-2 or order-3 is most appropriate
- 3: A model of order-3 or order-4 is most appropriate
- 4: A model of order-4 or order-5 is most appropriate
- MC2:
Does this confirm our findings of the 10-fold CV?- 1: No
- 2: Yes
- MC1:
- Fit a step function to predict
wageusingage, and perform cross-validation to choose the optimal number of cuts.- The procedure is similar than in the previous question. Set a seed value of 1.
- However, this time, use a model with
icuts in thei-th iteration. Store the results indeltas.cut. Check cuts 2 to 10;deltas.cutshould haveNAfor cut 1. - Store the optimal number of cuts in
d.min.cut.
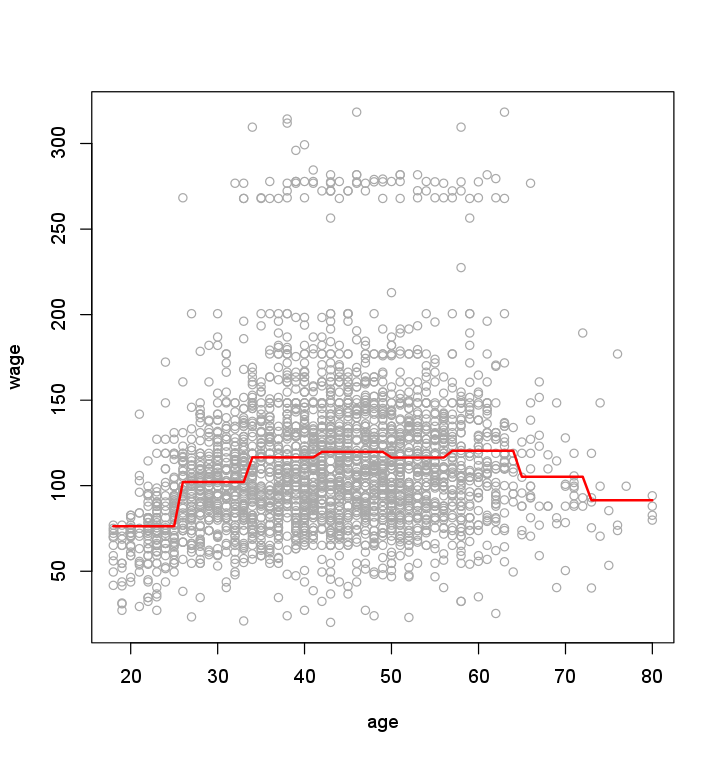
Try to recreate the following plot of a step function with 8 cuts fitted to the training data.
- Create a scatterplot of
wagevsageusing all the data. - Create a sequence
age.gridof integer values ranging from the lowestagevalue in the data to the highestagevalue observed. - Fit a step function with 8 cuts. Store the model in
fit8. - Using the model
fit8, predictwagefor the entire sequence. Store the result inpreds. - Add the predictions
predson the plot.
Assume that:
- The
ISLR2library has been loaded - The
Wagedataset has been loaded and attached - The
bootlibrary has been loaded