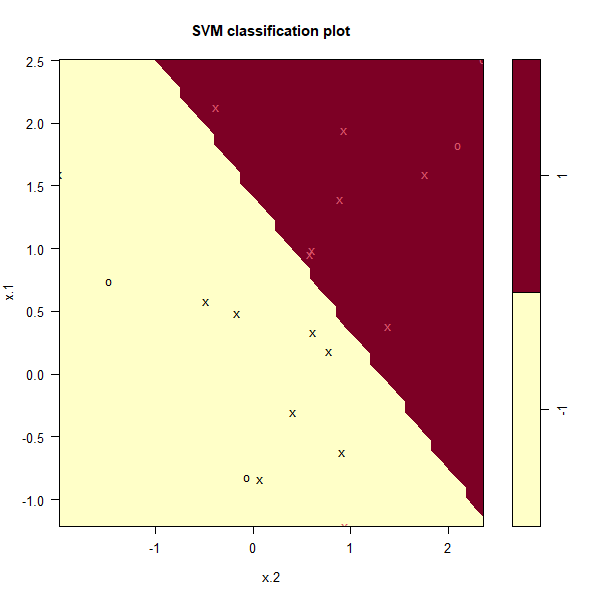
svmfit <- svm(y ~ ., data = dat, kernel = "linear", cost = 0.1, scale = FALSE)
plot(svmfit, dat)
svmfit$index

 [1]  1  2  3  4  5  7  9 10 12 13 14 15 16 17 18 20

Now that a smaller value of the cost parameter is being used, we obtain a
larger number of support vectors, because the margin is now wider. Unfortunately,
the svm() function does not explicitly output the coefficients of
the linear decision boundary obtained when the support vector classifier is
fit, nor does it output the width of the margin.