In this exercise, we use the Auto data set.
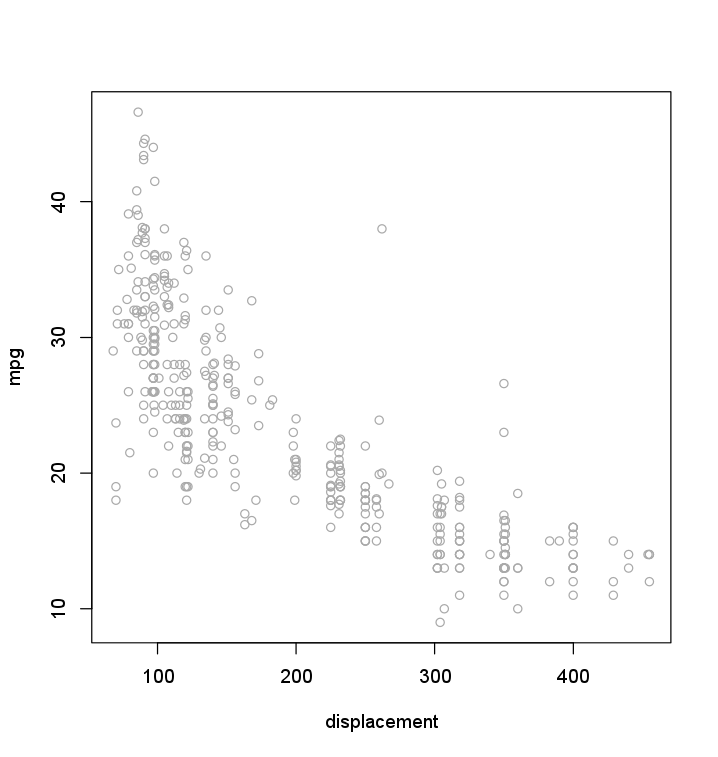
There seems to be a nice non-linear relationships between displacement (the cylinder volume) and the dependent variable mpg.
We fit a series of non-linear models to investigate the relationship.

Questions
Some of the exercises are not tested by Dodona (for example the plots), but it is still useful to try them.
- Fit step functions for a range of different number of cuts (from 2 to 10),
and perform 10-fold cross-validation to select the optimal number of cuts.
- Set a seed of 1. Write a for loop of 10 iterations.
In each iteration
i, fit a step function ofdisplacementto predictmpgwithicuts. - Store the CV error in the
i-th element of the vectordeltas.cut.Initialize the vector
deltas.cutas a vector of length 10 with valuesNA. - Plot the CV errors for the varying number of cuts.
- What is the optimal number of cuts? Store the answer in
d.min.cut.
- Set a seed of 1. Write a for loop of 10 iterations.
In each iteration
- Fit natural splines for a range of different degrees of freedom (from 3 to 10),
and perform 10-fold cross-validation to select the degrees of freedom.
- Set a seed of 1. Write a for loop of 10 iterations.
In each iteration
i, fit a natural spline ofdisplacementto predictmpgwithidegrees of freedom. - Store the CV error in the
i-th element of the vectordeltas.ns.Initialize the vector
deltas.nsas a vector of length 10 with valuesNA. - Plot the CV errors for the varying degrees of freedom.
- What is the optimal degrees of freedom? Store the answer in
df.min.ns.
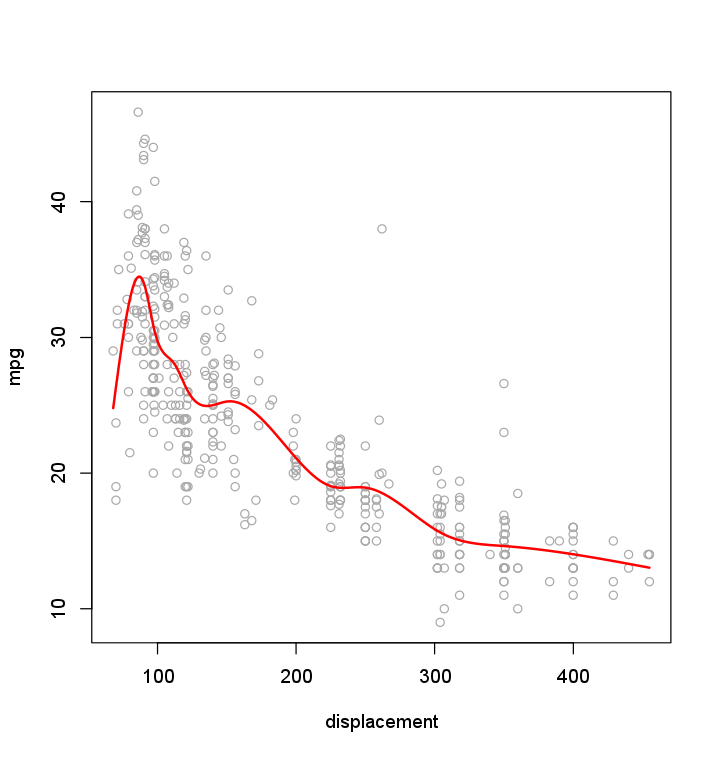
Try to fit the best natural spline model on the plot above:
- Create a scatterplot of
mpgvsdisplacementusing all the data. - Create a sequence
displacement.gridof values ranging from the lowestdisplacementvalue in the data to the highestdisplacementvalue observed, in steps of0.1. - Create the model
fit.nsusing the optimal degrees of freedomdf.min.ns, - predict
mpgfor the entire sequence. Store the result inpreds. - Add the predictions
predson the plot.
- Set a seed of 1. Write a for loop of 10 iterations.
In each iteration

Assume that:
- The
ISLR2library has been loaded - The
Autodataset has been loaded and attached - The
bootlibrary has been loaded - The
splineslibrary has been loaded