STEP 3. General analysis
In a third cleaning step, we will only keep real views, called pageviews, and no images etc. We do this by looking for files with htm(l) in the filename. However, pdf can also be included.
all_logs_cl_3 <- all_logs_cl_2 %>% filter(str_detect(file_name, "htm") | file_name == "/")

all_logs_cl_3
# A tibble: 30,571 x 11
   ip     file_name        status_code object_size origin       user_agent       data_origin time                 diff group session.id
   <chr>  <chr>                  <int>       <int> <chr>        <chr>            <chr>       <dttm>              <dbl> <dbl>      <int>
 1 104.2~ GET /predictive~         200       12836 -            mozilla/5.0 (x1~ blog        2017-07-31 06:28:54     0     0        180
 2 104.2~ GET /predictive~         200       12836 -            mozilla/5.0 (x1~ blog        2017-07-31 06:37:28     0     0        180
 3 52.17~ GET /predictive~         200       12836 -            mozilla/5.0 (x1~ blog        2017-07-31 06:33:24     0     0        183
 4 5.248~ GET /predictive~         200       47401 http://www.~ mozilla/5.0 (wi~ blog        2017-07-31 07:03:01     0     0        306
 5 113.1~ GET /faq.htm HT~         200        4548 http://www.~ mozilla/5.0 (li~ mma         2017-07-31 07:04:20     0     0        308
 6 112.6~ GET /predictive~         200       14682 -            mozilla/5.0 (ma~ blog        2017-07-31 07:17:30     0     0        398
 7 112.6~ GET /predictive~         200       14681 -            mozilla/5.0 (ip~ blog        2017-07-31 07:17:33     0     0        398
 8 112.6~ GET /predictive~         200       14682 -            mozilla/5.0 (ma~ blog        2017-07-31 10:19:33     1     1        399
 9 112.6~ GET /predictive~         200       14681 -            mozilla/5.0 (ip~ blog        2017-07-31 10:19:35     0     1        399
10 112.6~ GET /predictive~         200       14682 -            mozilla/5.0 (ma~ blog        2017-07-31 15:17:24     1     2        400
# ... with 30,561 more rows
Next, we will calculate some general insights.
- Number of unique visitors
uniqueVis <- unique(all_logs_cl_3$ip) length(uniqueVis) [1] 6816 - Number of page views per visitor
nrow(all_logs_cl_3)/length(uniqueVis) [1] 4.485182 - Views per webpage
with all clicks (so also on images)
viewWebpage <- all_logs_cl_2 %>% group_by(data_origin) %>% summarise(views = length(data_origin))
g1 <- ggplot(data = viewWebpage, aes(x = data_origin, y = views))
g1 + geom_bar(stat = 'identity')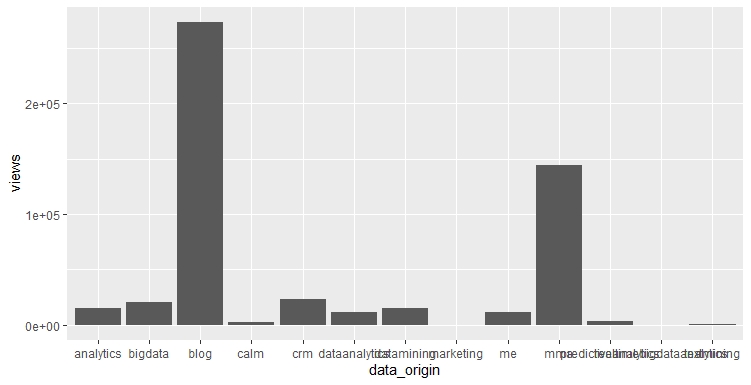
With only pageviews
viewWebpage2 <- all_logs_cl_3 %>% group_by(data_origin) %>% summarise(views = length(data_origin))
g2 <- ggplot(data = viewWebpage2, aes(x = data_origin, y = views))
g2 + geom_bar(stat = 'identity')
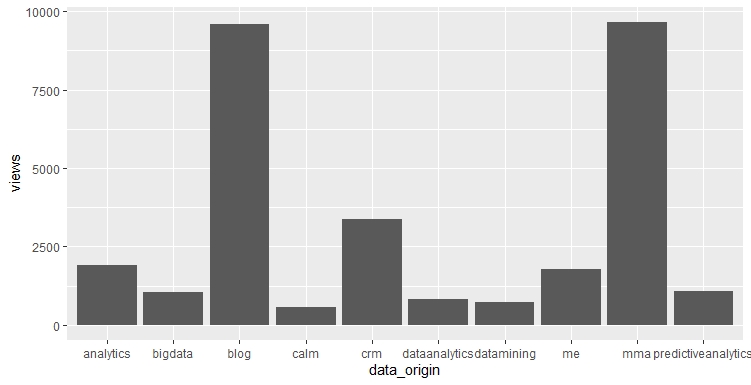
This shows that the blog probably contains more pictures that have to be loaded.
Exercise 1
Extract the pageviews from the logs data and store it as logs_cleaned3.
Exercise 2
Compute the number of unique visitors, the number of page views per visitor, and
the views per webpage of the pageviews and store it as unique_visitors,
page_views_per_visitor, and views_per_webpage, respectively.
To download the all_logs_ugent dataset click
here.
To download the logs dataset click
here.
Assume that:
- The
logs_cleaned2variable that was calculated in the previous exercise is given. - The
bots1andbots2data is given. - The stringr and dplyr packages are loaded.