In order to fit a smoothing spline, we use the smooth.spline() function.
This figure was produced with the following code:
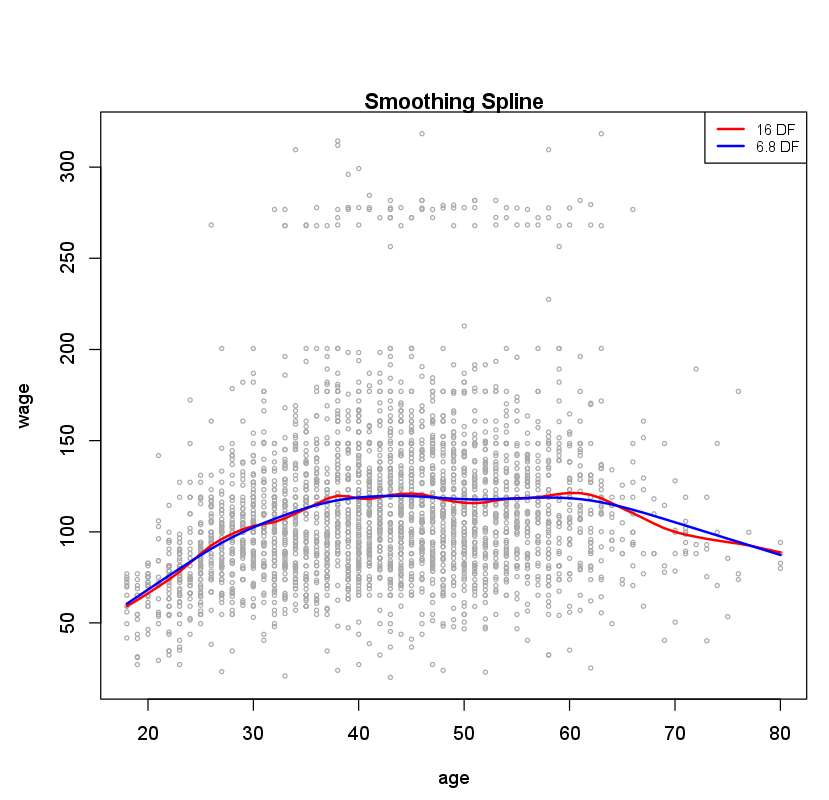
plot(age, wage, xlim = agelims, cex = .5, col = "darkgrey")
title("Smoothing Spline")
fit <- smooth.spline(age, wage, df = 16)
fit2 <- smooth.spline(age, wage, cv = TRUE)
fit2$df
[1] 6.794596
lines(fit, col = "red", lwd = 2)
lines(fit2, col = "blue", lwd = 2)
legend("topright", legend = c("16 DF", "6.8 DF"), col = c("red", "blue"), lty = 1, lwd = 2, cex = .8)
Notice that in the first call to smooth.spline(), we specified df=16. The
function then determines which value of \(\lambda\) leads to 16 degrees of freedom. In
the second call to smooth.spline(), we select the smoothness level by cross-validation;
this results in a value of \(\lambda\) that yields 6.8 degrees of freedom.
Questions
- Fit a smoothing spline on the Boston dataset with
medvas dependent variable andrmas independent variable. Determine the optimal degrees of freedom with cross-validation. Store the result in the variablefit. (note: please ignore the warning about non-unique ‘x’ values) - How many degrees of freedom does the smoothing spline have? Store the result in the variable
df.cvand do not hardcode the value.
Assume that:
- The MASS library has been loaded
- The Boston dataset has been loaded and attached