Using the importance() function, we can view the importance of each
variable.
importance(rf.boston)

          %IncMSE IncNodePurity
crim    16.697017    1076.08786
zn       3.625784      88.35342
indus    4.968621     609.53356
chas     1.061432      52.21793
nox     13.518179     709.87339
rm      32.343305    7857.65451
age     13.272498     612.21424
dis      9.032477     714.94674
rad      2.878434      95.80598
tax      9.118801     364.92479
ptratio  8.467062     823.93341
black    7.579482     275.62272
lstat   27.129817    6027.63740
Two measures of variable importance are reported. The first is based
upon the mean decrease of accuracy in predictions on the out of bag samples
when a given variable is excluded from the model. The second is a measure
of the total decrease in node impurity that results from splits over that
variable, averaged over all trees. In the
case of regression trees, the node impurity is measured by the training
RSS, and for classification trees by the deviance. Plots of these importance
measures can be produced using the varImpPlot() function.
varImpPlot(rf.boston)
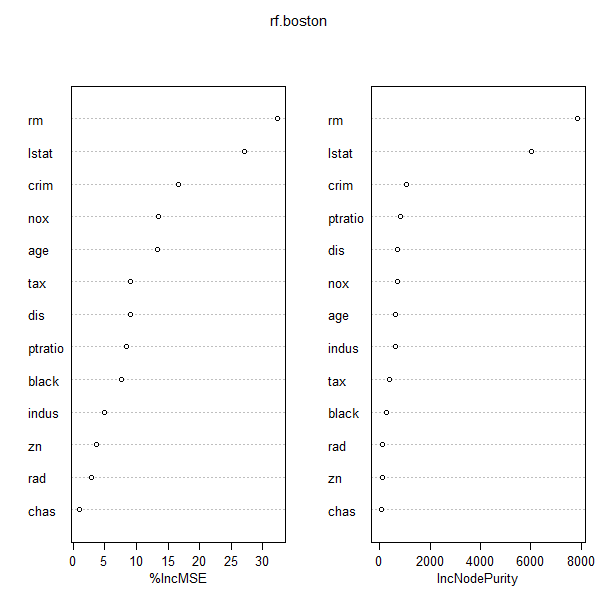
The results indicate that across all of the trees considered in the random
forest, the wealth level of the community (lstat) and the house size (rm)
are by far the two most important variables.
Questions
- Based on the random forest model that you built in the previous exercise, graph the variance importance plot and answer the following question:
MC1: Which one of these statements is correct? (only one correct answer)
- 1: The most important variables are the gross horsepower, weight and displacement of a car.
- 2: The most important variables are the engine type, number of forward gears and whether a car manual or automatic transmission.
- 3: The most important variables are the number of cylinders, rear axle ratio and number of carburetors.
Look at the documentation
?mtcarsto understand the meaning of the variables