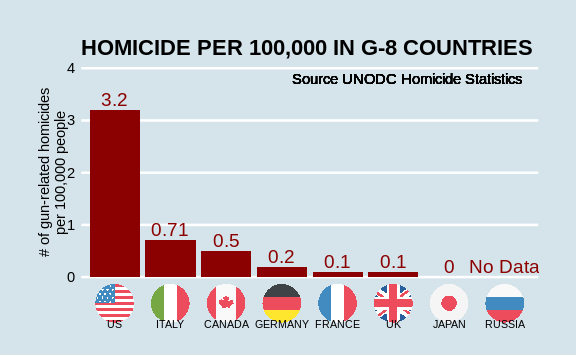
Imagine you live in Europe and are offered a job in a US company with many locations across all states. It is a great job, but news with headlines such as US Gun Homicide Rate Higher Than Other Developed Countries have you worried. Charts like this may concern you even more:
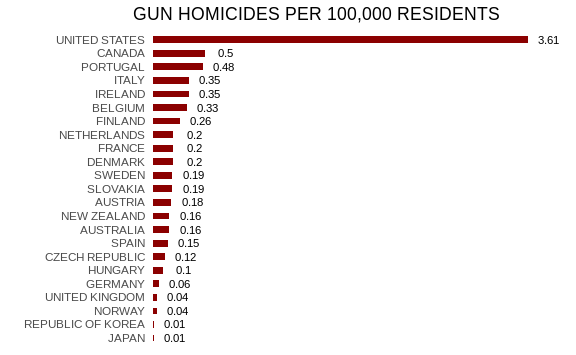
Or even worse, this version from
everytown.org:
But then you remember that the US is a large and diverse country with 50 very different states as well as the District of Columbia (DC).
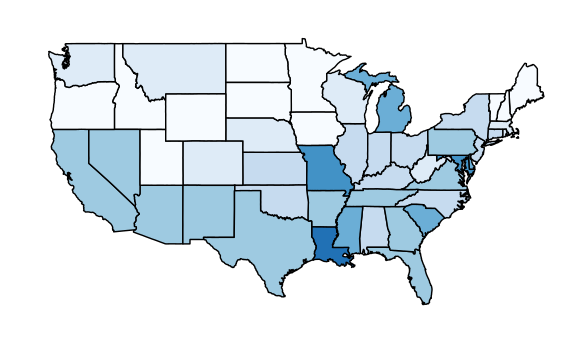
California, for example, has a larger population than Canada, and 20 US states have populations larger than that of Norway. In some respects, the variability across states in the US is akin to the variability across countries in Europe. Furthermore, although not included in the charts above, the murder rates in Lithuania, Ukraine, and Russia are higher than 4 per 100,000. So perhaps the news reports that worried you are too superficial. You have options of where to live and want to determine the safety of each particular state. We will gain some insights by examining data related to gun homicides in the US during 2010 using R.
Before we get started with our example, we need to cover logistics as well as some of the very basic building blocks that are required to gain more advanced R skills. Be aware that the usefulness of some of these building blocks may not be immediately obvious, but later in the book you will appreciate having mastered these skills.