We begin with the BrainCancer data set, which is part of the ISLR2 package.
library(ISLR2)
The rows index the 88 patients, while the columns contain the 8 predictors.
> names(BrainCancer)
[1] "sex"       "diagnosis" "loc"       "ki"        "gtv"       "stereo"
[7] "status"    "time"
We first briefly examine the data.
> attach(BrainCancer)
> table(sex)
sex
Female   Male
    45     43
> table(diagnosis)
diagnosis
Meningioma  LG glioma  HG glioma      Other
        42          9         22         14
> table(status)
status
 0  1
53 35
Before beginning an analysis, it is important to know how the status variable
has been coded. Most software, including R, uses the convention that
status = 1 indicates an uncensored observation, and status = 0 indicates
a censored observation. But some scientists might use the opposite coding.
For the BrainCancer data set 35 patients died before the end of the study.
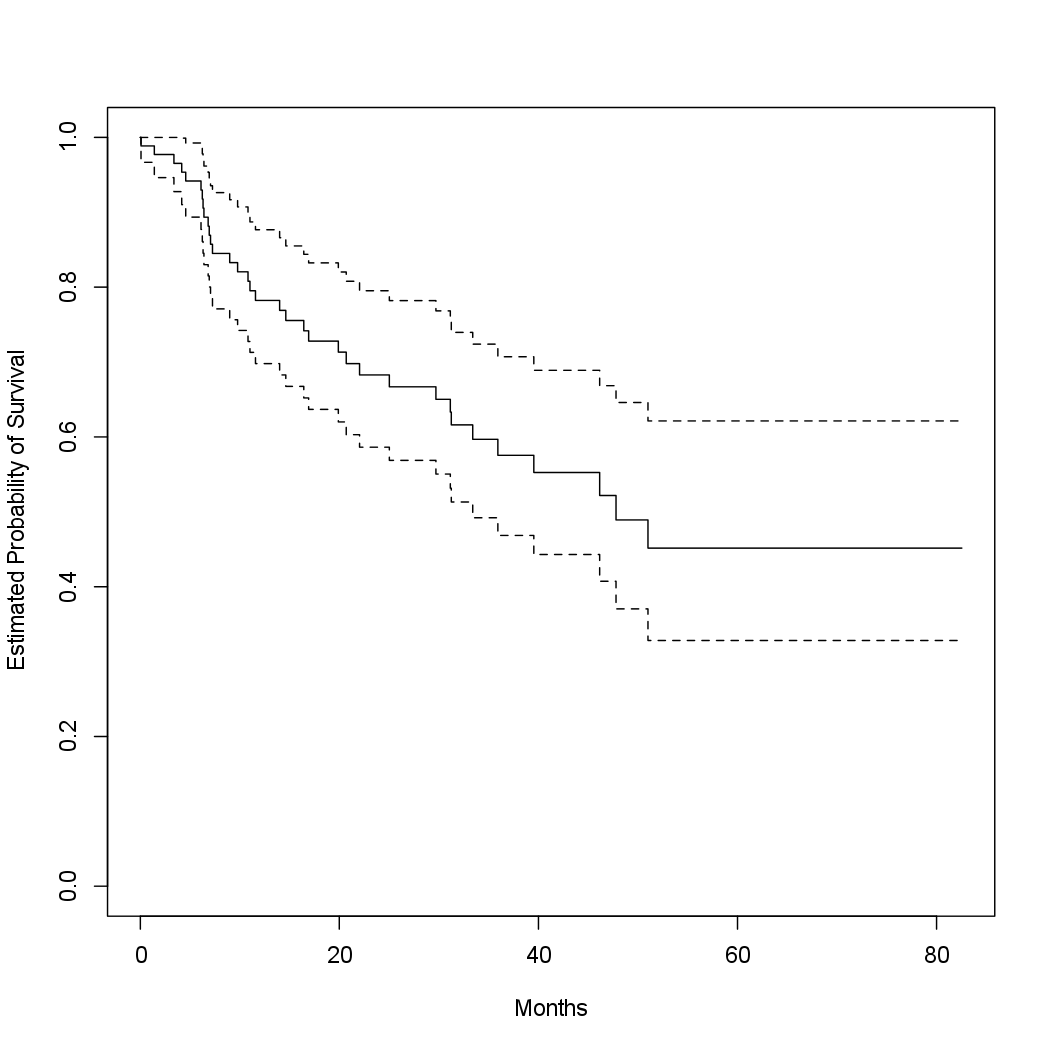
To begin the analysis, we re-create the Kaplan-Meier survival curve
shown in Figure 11.2, using the survfit() function within the R survival
library. Here time corresponds to \(y_i\), the time to the ith event (either censoring
or death).
library(survival)
fit.surv <- survfit(Surv(time, status) ~ 1)
plot(fit.surv, xlab = "Months", ylab = "Estimated Probability of Survival")
If you prefer not to attach the data, add the argument
data = BrainCancerin the function call.
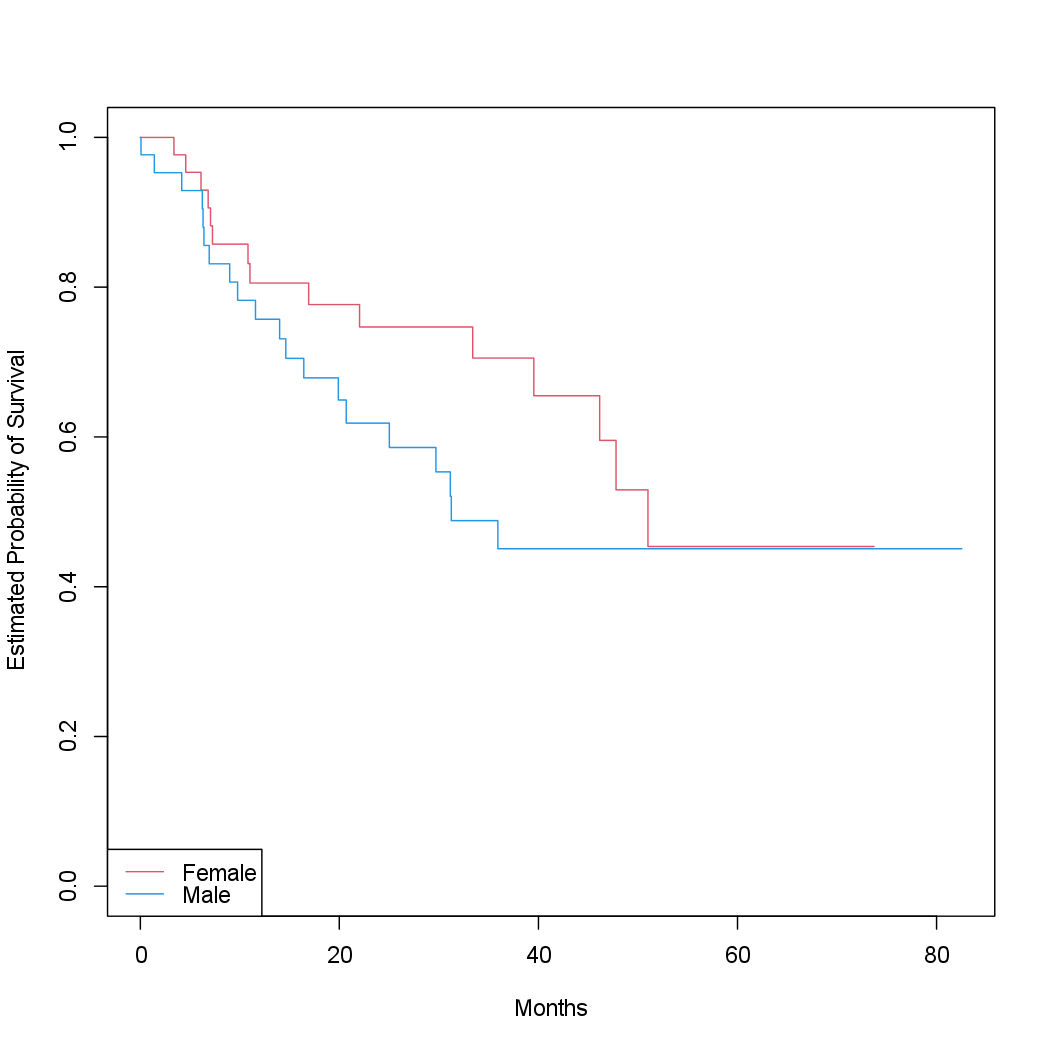
Next we create Kaplan-Meier survival curves that are stratified by sex, in
order to reproduce Figure 11.3.
fit.sex <- survfit(Surv(time, status) ~ sex)
plot(fit.sex, xlab = "Months", ylab = "Estimated Probability of Survival", col = c(2, 4))
legend("bottomleft", levels(sex), col = c(2, 4), lty = 1)
Questions
Next, we consider the dataset Publication (found in the ISLR2 library) involving the time to publication
of journal papers reporting the results of clinical trials funded by the
National Heart, Lung, and Blood Institute. For 244 trials, the time in
months until publication is recorded. Of the 244 trials, only 156 were published
during the study period; the remaining studies were censored. The
covariates include whether the trial focused on a clinical endpoint (clinend),
whether the trial involved multiple centers (multi), the funding mechanism
within the National Institutes of Health (mech), trial sample size (sampsize),
budget (budget), impact (impact, related to the number of citations), and
whether the trial produced a positive (significant) result (posres). The last
covariate is particularly interesting, as a number of studies have suggested
that positive trials have a higher publication rate.
> head(Publication)
  posres multi clinend     mech sampsize    budget impact      time status
1      0     0       1      R01    39876  8.016941 44.016 11.203285      1
2      0     0       1      R01    39876  8.016941 23.494 15.178645      1
3      0     0       1      R01     8171  7.612606  8.391 24.410678      1
4      0     0       1 Contract    24335 11.771928 15.402  2.595483      1
5      0     0       1 Contract    33357 76.517537 16.783  8.607803      1
6      0     0       1 Contract    10355  9.809938 16.783  8.607803      1
- Create a Kaplan-Meier curve for the
Publicationdataset. Store the output of thesurvfit()function infit.pub. - Create a Kaplan-Meier curve for the
Publicationdataset stratified on theposresvariable. Store the output of thesurvfit()function infit.posres.
Assume that:
- The
ISLR2andsurvivallibraries has been loaded - The
Publicationdataset has been loaded and attached