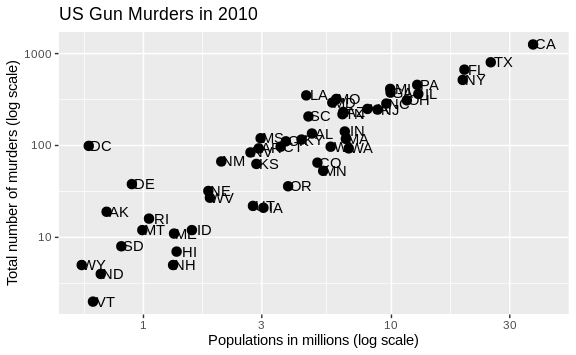
Similarly, the cheat sheet quickly reveals that to change labels and add a title, we use the following functions:
p + geom_point(size = 3) +
  geom_text(nudge_x = 0.05) +
  scale_x_log10() +
  scale_y_log10() +
  xlab("Populations in millions (log scale)") +
  ylab("Total number of murders (log scale)") +
  ggtitle("US Gun Murders in 2010")

We are almost there! All we have left to do is add color, a legend, and optional changes to the style.