We will begin by examining some numerical and graphical summaries of
the Smarket data, which is part of the ISLR2 library. This data set consists of
percentage returns for the S&P 500 stock index over 1, 250 days, from the
beginning of 2001 until the end of 2005. For each date, we have recorded
the percentage returns for each of the five previous trading days, Lag1
through Lag5. We have also recorded Volume (the number of shares traded
on the previous day, in billions), Today (the percentage return on the date
in question) and Direction (whether the market was Up or Down on this
date).
> library(ISLR2)
> names(Smarket)
[1] "Year"      "Lag1"      "Lag2"      "Lag3"      "Lag4"      "Lag5"
[7] "Volume"    "Today"     "Direction"
> dim(Smarket)
[1] 1250    9
> summary(Smarket)
      Year           Lag1                Lag2                Lag3
 Min.   :2001   Min.   :-4.922000   Min.   :-4.922000   Min.   :-4.922000
 1st Qu.:2002   1st Qu.:-0.639500   1st Qu.:-0.639500   1st Qu.:-0.640000
 Median :2003   Median : 0.039000   Median : 0.039000   Median : 0.038500
 Mean   :2003   Mean   : 0.003834   Mean   : 0.003919   Mean   : 0.001716
 3rd Qu.:2004   3rd Qu.: 0.596750   3rd Qu.: 0.596750   3rd Qu.: 0.596750
 Max.   :2005   Max.   : 5.733000   Max.   : 5.733000   Max.   : 5.733000
      Lag4                Lag5              Volume           Today
 Min.   :-4.922000   Min.   :-4.92200   Min.   :0.3561   Min.   :-4.922000
 1st Qu.:-0.640000   1st Qu.:-0.64000   1st Qu.:1.2574   1st Qu.:-0.639500
 Median : 0.038500   Median : 0.03850   Median :1.4229   Median : 0.038500
 Mean   : 0.001636   Mean   : 0.00561   Mean   :1.4783   Mean   : 0.003138
 3rd Qu.: 0.596750   3rd Qu.: 0.59700   3rd Qu.:1.6417   3rd Qu.: 0.596750
 Max.   : 5.733000   Max.   : 5.73300   Max.   :3.1525   Max.   : 5.733000
 Direction
 Down:602
 Up  :648
The cor() function produces a matrix that contains all of the pairwise
correlations among the predictors in a data set. The first command below
gives an error message because the Direction variable is qualitative.
> cor(Smarket)
Error in cor(Smarket): 'x' must be numeric

> cor(Smarket[, -9])
             Year         Lag1         Lag2         Lag3         Lag4         Lag5
Year   1.00000000  0.029699649  0.030596422  0.033194581  0.035688718  0.029787995
Lag1   0.02969965  1.000000000 -0.026294328 -0.010803402 -0.002985911 -0.005674606
Lag2   0.03059642 -0.026294328  1.000000000 -0.025896670 -0.010853533 -0.003557949
Lag3   0.03319458 -0.010803402 -0.025896670  1.000000000 -0.024051036 -0.018808338
Lag4   0.03568872 -0.002985911 -0.010853533 -0.024051036  1.000000000 -0.027083641
Lag5   0.02978799 -0.005674606 -0.003557949 -0.018808338 -0.027083641  1.000000000
Volume 0.53900647  0.040909908 -0.043383215 -0.041823686 -0.048414246 -0.022002315
Today  0.03009523 -0.026155045 -0.010250033 -0.002447647 -0.006899527 -0.034860083
            Volume        Today
Year    0.53900647  0.030095229
Lag1    0.04090991 -0.026155045
Lag2   -0.04338321 -0.010250033
Lag3   -0.04182369 -0.002447647
Lag4   -0.04841425 -0.006899527
Lag5   -0.02200231 -0.034860083
Volume  1.00000000  0.014591823
Today   0.01459182  1.000000000
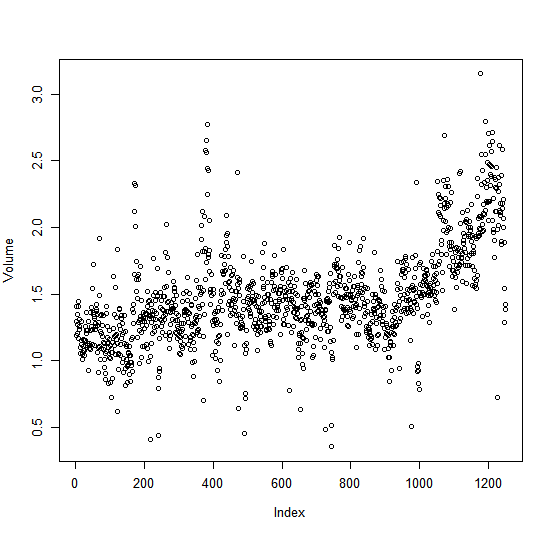
As one would expect, the correlations between the lag variables and today’s returns are close to zero. In other words, there appears to be little correlation between today’s returns and previous days’ returns. The only substantial correlation is between Year and Volume. By plotting the data we see that Volume is increasing over time. In other words, the average number of shares traded daily increased from 2001 to 2005.
attach(Smarket)
plot(Volume)