Now that we are done testing, we can write one piece of code that produces our desired plot from scratch.
library(ggthemes)
library(ggrepel)
r <- murders %>%
summarize(rate = sum(total) / sum(population) * 10^6) %>%
pull(rate)
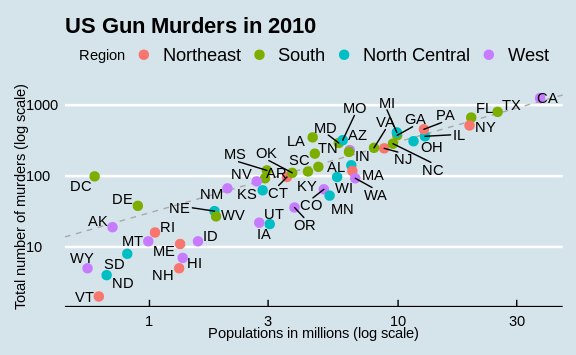
murders %>% ggplot(aes(population/10^6, total, label = abb)) +
geom_abline(intercept = log10(r), lty = 2, color = "darkgrey") +
geom_point(aes(col=region), size = 3) +
geom_text_repel() +
scale_x_log10() +
scale_y_log10() +
xlab("Populations in millions (log scale)") +
ylab("Total number of murders (log scale)") +
ggtitle("US Gun Murders in 2010") +
scale_color_discrete(name = "Region") +
theme_economist()