Next, we consider whether pruning the tree might lead to improved
results. The function cv.tree() performs cross-validation in order to
determine the optimal level of tree complexity; cost complexity pruning
is used in order to select a sequence of trees for consideration. We use
the argument FUN=prune.misclass in order to indicate that we want the
classification error rate to guide the cross-validation and pruning process,
rather than the default for the cv.tree() function, which is deviance. The
cv.tree() function reports the number of terminal nodes of each tree considered
(size) as well as the corresponding error rate and the value of the
cost-complexity parameter used (k, which corresponds to \(\alpha\) in \(\sum_{m=1}^{| T |} \sum_{x_i \in R_m} (y_i - \hat{y}_{R_m})^2 + \alpha |T|\)).
set.seed(7)
cv.carseats <- cv.tree(tree.carseats, FUN = prune.misclass)
names(cv.carseats)
[1] "size"   "dev"    "k"      "method"

cv.carseats
$size
[1] 21 19 14  9  8  5  3  2  1

$dev
[1] 75 75 75 74 82 83 83 85 82
$k
[1] -Inf  0.0  1.0  1.4  2.0  3.0  4.0  9.0 18.0

$method
[1] "misclass"

attr(,"class")
[1] "prune"         "tree.sequence"
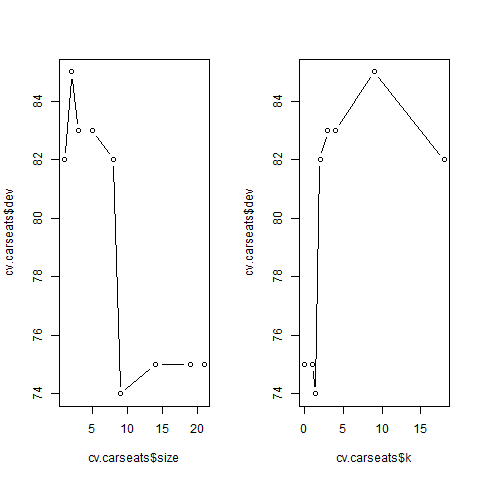
Note that, despite the name, dev corresponds to the cross-validation error
rate in this instance. The tree with 9 terminal nodes results in the lowest
cross-validation error rate, with 74 cross-validation errors.We plot the error
rate as a function of both size and k.
par(mfrow = c(1, 2))
plot(cv.carseats$size, cv.carseats$dev, type = "b")
plot(cv.carseats$k, cv.carseats$dev, type = "b")
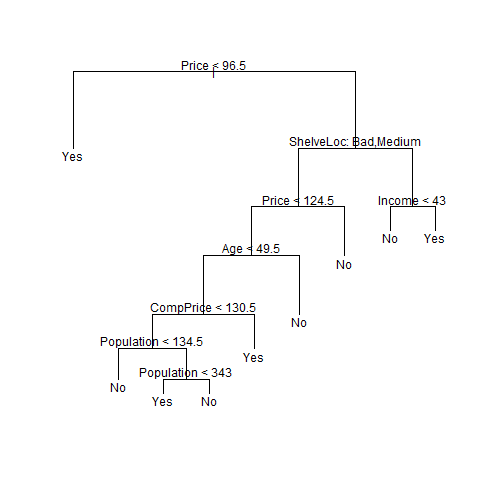
We now apply the prune.misclass() function in order to prune the tree to obtain the nine-node tree.
prune.carseats <- prune.misclass(tree.carseats, best = 9)
plot(prune.carseats)
text(prune.carseats, pretty = 0)
How well does this pruned tree perform on the test data set? Once again,
we apply the predict() function.
tree.pred <- predict(prune.carseats, Carseats.test, type = "class")
table(tree.pred, High.test)
         High.test
tree.pred No Yes
      No  97  25
      Yes 20  58

(97 + 58) / 200
[1] 0.775
Now 77.5% of the test observations are correctly classified, so not only has the pruning process produced a more interpretable tree, but it has also improved the classification accuracy.
Questions
- Increase the value of
bestto 15 in theprune.misclass()function, so we obtain a larger pruned tree. Store the result in the variableprune.carseats. - Use the tree to make class predictions on the test set.
Store the predictions in the variable
tree.pred. - Calculate the confusion matrix. (note: give the predictions as the first argument in the
table()function, and the ground truth as the second argument). Store the result in the variablecf.test. - Finally, calculate the test set accuracy. Store the result in the variable
acc.test.
(note: try to avoid hardcoding and use e.g. thesum()anddiag()functions on the confusion matrix)
Below, you find the necessary variables.
Assume that:
- The ISLR2 and tree libraries have been loaded
- The Carseats dataset has been loaded and attached