This exercise involves the Boston housing data set.
To begin, load in the Boston data set. The Boston data set is
part of the MASS library in R.
library(MASS)
data(Boston)
Now the data set is contained in the object Boston.
Boston
Read about the data set:
?Boston
Questions
Some of the exercises are not tested by Dodona (for example the plots), but it is still useful to try them.
-
How many rows are in this data set? How many columns? What do the rows and columns represent? Store the number of rows in
boston.nrowand number of columns inboston.ncol. -
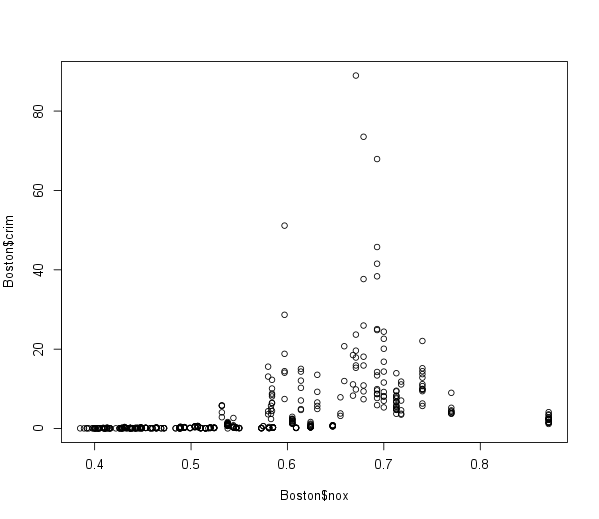
Make some pairwise scatterplots of the predictors in this data set.
An example of how this could look like:

-
Which predictor has the highest absolute correlation with per capita crime rate? Store the name of the variable in
high.cor(e.g.,high.cor <- "lstat") -
Do any of the suburbs of Boston appear to have particularly high crime rates? Tax rates? Pupil-teacher ratios?
-
How many of the suburbs in this data set bound the Charles river? Store the answer in
n.charles. -
What is the median pupil-teacher ratio among the towns in this data set? Store the answer in
ptratio.median. -
Which suburb of Boston has tax rates? Store the row number of the suburb in
lowest.tax.num. What are the values of the other predictors for that suburb?
Store the entire row with all variables that corresponds tolowest.tax.numinlowest.tax. How do those values compare to the overall ranges for those predictors? -
In this data set, how many of the suburbs average more than seven rooms per dwelling? Store the number of suburbs in
rm.high.
Assume that:
- The MASS library has been loaded
- The Boston dataset has been loaded and attached