Introduction Case
Assume we have a group of 10 business engineering students working on a group project. Some of them follow data analytics (DA) and the others operations research (OR). They all belong to one of the two groups: DA or OR. These students sometimes collaborate when they are working on a group project. They can therefore be linked together to form a network. In this case, two students are connected if they are currently working together. As a result we have three types of edges in the network:
- edges that connect two DA students, denoted by ‘dd’
- edges that connect two OR students, denoted by ‘oo’
- edges that connect a DA and OR student, denoted by ‘do’.
2. Plot the Network
g <- graph_from_data_frame(StudentsNetwork, directed = FALSE)
V(g)$master <- as.character(Students$master)
layout <- layout_nicely(g)
plot.igraph(g,
            edge.label = NA,
            edge.color = ifelse(StudentsNetwork$label == "dd", "blue", ifelse(StudentsNetwork$label == "do", "red", "darkgreen")),
            layout = layout,
            vertex.label = V(g)$name,
            vertex.color = ifelse(V(g)$master == "DA", "blue", "darkgreen"),
            vertex.label.color = 'white')
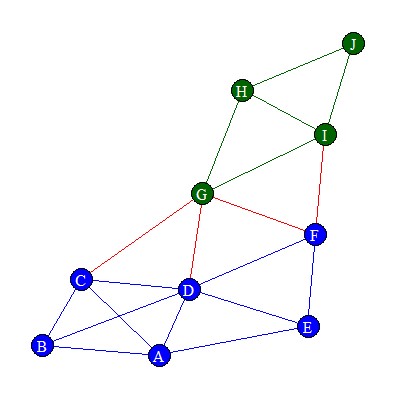
The blue nodes denote DA students and the green nodes OR students. Blue edges connect two DA student, green edges connect two OR students and red edges connect a DA and an OR student. These are the cross label edges. Clearly, DA students tend to collaborate with each other and the same holds for the OR students. In contrast, there are not so many edges between the two student groups.
Practice
Assume we have a group of 6 students: Tom, Sofie, Arno, Jan, Karen and Laura. Assume that Tom, Sofie and Arno are business engineering (B) students, while Jan, Karen and Laura are studying economics (E). They all belong to one of the two groups: B or E. All 6 students are going on an exchange programme next semester. Therefore, the students can be linked together based on the destination that they are going to:
| Destination | Student 1 | Student 2 |
|---|---|---|
| France | Tom | Arno |
| Switzerland | Sofie | Jan |
| China | Karen | Laura |
As a result we have three types of edges in the network:
- edges that connect two B students, denoted by ‘bb’
- edges that connect two E students, denoted by ‘ee’
- edges that connect a B and E student, denoted by ‘be’.
Exercise
Make a plot of the network and store it as StudentsPlot.
Identify the B students as blue nodes and the E students as darkgreen nodes.
Use blue edges to connect two B students, darkgreen edges to connect two E students and
red edges to connect a B and an E student.
Assume that:
- The
StudentsNetworkfrom the previous exercise is given, together with the variablesnames,master, andStudents. - The igraph library has been loaded.