In order to perform local regression, we use the loess() function.
plot(age, wage, xlim = agelims, cex = .5, col = "darkgrey")
title("Local Regression")
fit <- loess(wage ~ age, span = .2, data = Wage)
fit2 <- loess(wage ~ age, span = .5, data = Wage)
lines(age.grid, predict(fit, data.frame(age = age.grid)), col = "red", lwd = 2)
lines(age.grid, predict(fit2, data.frame(age = age.grid)), col = "blue", lwd = 2)
legend("topright", legend = c("Span=0.2", "Span=0.5"), col = c("red", "blue"), lty = 1, lwd = 2, cex = .8)
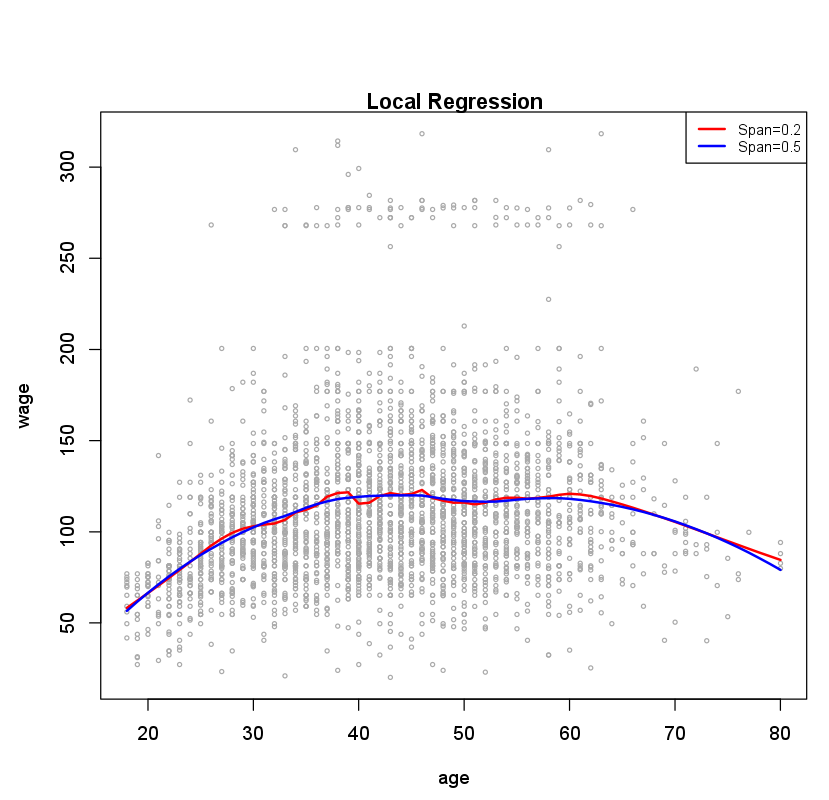
Here we have performed local linear regression using spans of 0.2 and 0.5:
that is, each neighborhood consists of 20% or 50% of the observations. The
larger the span, the smoother the fit. The locfit library can also be used
for fitting local regression models in R.
Questions
- Fit a local regression on the Boston dataset with
medvas dependent variable andrmas independent variable. Use a span of 0.4. Store the result in the variablefit. - Calculate the predictions of
medvfor a series of values ofrm, ranging from 4 to 8, in steps of 0.1. Store the results in variablepreds. - MC1: Imagine that we decrease the span to 0.2, what would happen to the fit?
- 1: The fit is less smooth
- 2: The fit is more smooth
- 3: The fit is equally smooth
Assume that:
- The MASS library has been loaded
- The Boston dataset has been loaded and attached