A second layer in the plot we wish to make involves adding a label to
each point to identify the state. The geom_label and geom_text
functions permit us to add text to the plot with and without a rectangle
behind the text, respectively.
Because each point (each state in this case) has a label, we need an
aesthetic mapping to make the connection between points and labels. By
reading the help file, we learn that we supply the mapping between point
and label through the label argument of aes. So the code looks like
this:
p + geom_point(aes(population/10^6, total)) +
  geom_text(aes(population/10^6, total, label = abb))
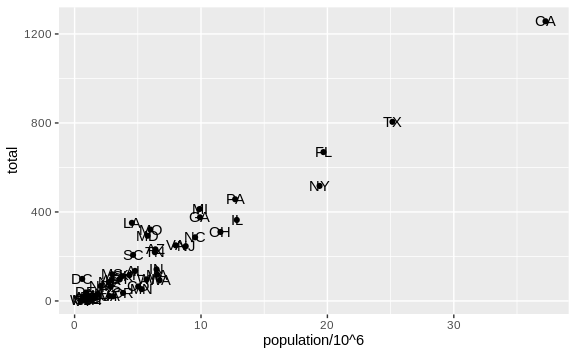
We have successfully added a second layer to the plot.
As an example of the unique behavior of aes mentioned above, note that
this call:
p_test <- p + geom_text(aes(population/10^6, total, label = abb))
is fine, whereas this call:
p_test <- p + geom_text(aes(population/10^6, total), label = abb)
will give you an error since abb is not found because it is outside of
the aes function. The layer geom_text does not know where to find
abb since it is a column name and not a global variable.
Tinkering with arguments
Each geometry function has many arguments other than aes and data.
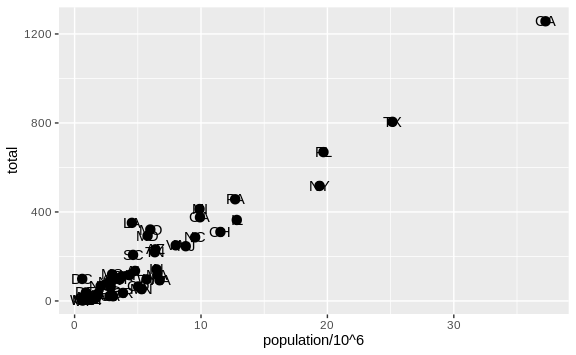
They tend to be specific to the function. For example, in the plot we
wish to make, the points are larger than the default size. In the help
file we see that size is an aesthetic and we can change it like this:
p + geom_point(aes(population/10^6, total), size = 3) +
  geom_text(aes(population/10^6, total, label = abb))
size is not a mapping: whereas mappings use data from specific
observations and need to be inside aes(), operations we want to affect
all the points the same way do not need to be included inside aes.
Now because the points are larger it is hard to see the labels. If we
read the help file for geom_text, we see the nudge_x argument, which
moves the text slightly to the right or to the left:
p + geom_point(aes(population/10^6, total), size = 3) +
  geom_text(aes(population/10^6, total, label = abb), nudge_x = 1.5)
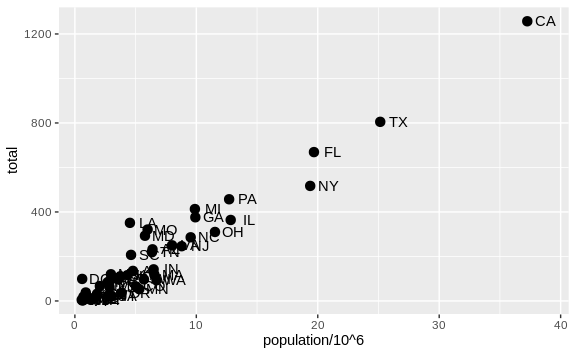
This is preferred as it makes it easier to read the text. In Section 7.11 we learn a better way of assuring we can see the points and the labels.