Calculating the validation errors manually was a little tedious, partly because there is no predict() method
for regsubsets(). Since we will be using this function again, we can capture
our steps above and write our own predict method.
predict.regsubsets <- function(object, newdata, id, ...) {
  mat <- model.matrix(Salary ~ ., data = newdata) # change the dependent variable for other data
  coefi <- coef(object, id = id)
  xvars <- names(coefi)
  mat[, xvars] %*% coefi
}
Our function pretty much mimics what we did in the previous exercise. The only complex
part is how we extracted the formula used in the call to regsubsets(). We
demonstrate how we use this function below, when we do cross-validation.
Finally, we perform best subset selection on the full data set, and select the best ten-variable model. It is important that we make use of the full data set in order to obtain more accurate coefficient estimates. Note that we perform best subset selection on the full data set and select the best ten-variable model, rather than simply using the variables that were obtained from the training set, because the best ten-variable model on the full data set may differ from the corresponding model on the training set.
> regfit.best <- regsubsets(Salary ~ ., data = Hitters, nvmax = 19)
> coef(regfit.best, 10)
 (Intercept)        AtBat         Hits        Walks
 162.5354420   -2.1686501    6.9180175    5.7732246
      CAtBat        CRuns         CRBI       CWalks
  -0.1300798    1.4082490    0.7743122   -0.8308264
   DivisionW      PutOuts      Assists
-112.3800575    0.2973726    0.2831680
In fact, we see that the best ten-variable model on the full data set has a different set of variables than the best ten-variable model on the training set.
We now try to choose among the models of different sizes using cross-validation. This approach is somewhat involved, as we must perform best subset selection within each of the \(k\) training sets. Despite this, we see that with its clever subsetting syntax, R makes this job quite easy. First, we create a vector that allocates each observation to one of \(k = 10\) folds, and we create a matrix in which we will store the results.
k <- 10
set.seed(1)
folds <- sample(1:k, nrow(Hitters), replace = TRUE)
cv.errors <- matrix(NA, k, 19, dimnames = list(NULL, paste(1:19)))
Now we write a for loop that performs cross-validation. In the \(j\)th fold, the
elements of folds that equal \(j\) are in the test set, and the remainder are in
the training set. We make our predictions for each model size (using our
new predict() method), compute the test errors on the appropriate subset,
and store them in the appropriate slot in the matrix cv.errors.
for (j in 1:k) {
  best.fit <- regsubsets(Salary ~ ., data = Hitters[folds != j,], nvmax = 19)
  for (i in 1:19) {
    pred <- predict(best.fit, Hitters[folds == j,], id = i)
    cv.errors[j, i] <- mean((Hitters$Salary[folds == j] - pred)^2)
  }
}
This has given us a 10×19 matrix, of which the \((i, j)\)th element corresponds
to the test \(MSE\) for the \(i\)th cross-validation fold for the best \(j\)-variable
model. We use the apply() function to average over the columns of this
matrix in order to obtain a vector for which the \(j\)th element is the cross-validation
error for the \(j\)-variable model.
> mean.cv.errors <- apply(cv.errors, 2, mean)
> mean.cv.errors
       1        2        3        4        5        6
149821.1 130922.0 139127.0 131028.8 131050.2 119538.6
       7        8        9       10       11       12
124286.1 113580.0 115556.5 112216.7 113251.2 115755.9
      13       14       15       16       17       18
117820.8 119481.2 120121.6 120074.3 120084.8 120085.8
      19
120403.5
> par(mfrow = c(1, 1))
> plot(mean.cv.errors, type = 'b')
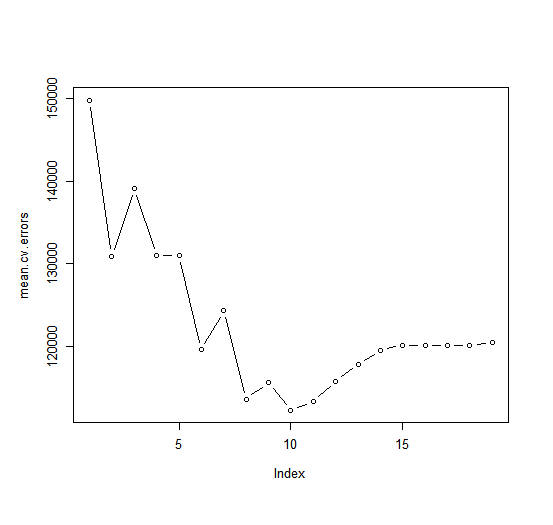
We see that cross-validation selects an 10-variable model. We now perform best subset selection on the full data set in order to obtain the 10-variable model.
> reg.best <- regsubsets(Salary ~ ., data = Hitters, nvmax = 19)
> coef(reg.best, 10)
 (Intercept)        AtBat         Hits        Walks       CAtBat        CRuns
 162.5354420   -2.1686501    6.9180175    5.7732246   -0.1300798    1.4082490
        CRBI       CWalks    DivisionW      PutOuts      Assists
   0.7743122   -0.8308264 -112.3800575    0.2973726    0.2831680
Questions
- Using the boston dataset, perform a ten-fold cross-validation to find the best \(j\)-variable model
- Redefine the
predict.regsubsets()function by changing the dependent variable in themodel.matrix()function - Create a vector that allocates each observation to one of \(k = 10\) folds and store it in
folds - Create a matrix in which the cross-validation errors will be stored, store it in
cv.errors - Write a for loop that performs the cross-validation
- Calculate the mean cross validation errors and store them in
mean.cv.errors - Determine the optimal value for \(j\) by looking at the plot or
mean.cv.errors - Store the coefficients of the best \(j\)-variable model in
reg.best.coef
- Redefine the
Note: The Hitters dataset has 19 predictors, the Boston dataset has only 13.
Assume that:
- The
MASSandleapslibraries have been loaded - The
Bostondataset has been loaded and attached - The seed has been set on 1